Windows Live Response Tool Kit
|
| < Day Day Up > |
|
Setting up your response media so that it is bootable with its own mini-OS is handy, but often you need to work with a live OS. In this section, we will generate a live response tool kit using several critical Windows tools, all of which should be transferred to the response media so that they can be transported to a victimized machine. You will need to copy each of the tools listed in this section from its source (which is also listed in each section) to the response media. Additionally, since you will want to limit what files are touched on the source machine (the machine that may have been hacked), you must copy all associated dynamic-link libraries (DLLs) and auxiliary files each executable will need to run. For instance, any programs you would want to use from the Cygwin distribution (see Chapter 3) must also be bundled with the cygwin1.dll library. Although this is only one tool kit used to perform a live response, any tool can be included as long as it is scrutinized and any supporting files are included (such as DLLs).
| Note | In this chapter, D: will be used to indicate the drive on the source machine in which the response media resides. This drive letter may be different for your specific live response scenario. |
To use the live response tool kit, you will be logged in as the true administrator (or you’ll at least have administrator privileges). Most of these commands cannot produce output unless you have administrative access to the objects they were designed to analyze.
The output of all commands run in the response will be delivered to a destination workstation for storage and analysis—you do not want to write the information to the local victim’s hard drive, as it could destroy potential evidence. You transmit the information across the network with Netcat (or Cryptcat) using the following command executed on the destination (forensic) machine:
C:\> nc -l -p <destination port> > <command>.txt
The <command> token is each of the commands run on the source (victim) machine.
On the source machine, type the following command to execute <command> and transfer the information to the destination workstation at <destination IP> over TCP port <destination port>:
D:\> <command> | D:\nc <destination IP> <destination port>
| Note | The latter part of this command ( | D:\nc <destination IP> <destination port>) must be inserted into the commands introduced in this chapter, even though they are not printed in the examples. This is intended, hopefully, to avoid confusion and keep things simple as you learn the concepts of the tools rather than the specific syntax of network-based transfers. |
cmd.exe
Place yourself in the shoes of an attacker. You want to hide your unauthorized access to the system administrator account. If you place a modified version of the command shell on your compromised server that hides network connections originating from your attacking workstation, you can move your attack further along.
Now, switch your line of thinking back to the incident responder. Because the command shell can be modified (typically after an administrator account has been compromised), the responder cannot trust the output from it. Therefore, we must bring our own when responding to an incident.
The trusted command shell is cmd.exe, which is located on every Windows NT or 2000 system at C:\winnt\system32\cmd.exe.
Implementation
The first tool you will need in your live response media kit will be a trusted command shell. After you are logged onto the victim machine, choose Start | Run, and then type the following command:
D:\>cmd.exe
A new command shell will appear on the D: drive. All the other commands discussed in this chapter will be executed within this trusted command shell. Any commands used here will be considered trusted because they are not running through the untrusted command shell (at C:\winnt\system32\cmd.exe) from the compromised server.
Fport
fport is one of the first commands we usually run on a compromised server during the response process. Fport is a freely available tool distributed by Foundstone, Inc., at http://www.foundstone.com. This tool maps every open TCP and UDP port on the victim machine to a running executable on the system. Fport is a useful tool to use in locating different types of backdoors that would allow an attacker an easier entry into your system.
Implementation
The command-line usage of fport is simple:
D:\> fport
fport returns information similar to the following (this particular information is returned from the machine discussed in the Case Study at the end of the "Windows Live Response Tool Kit" section):
FPort v2.0 - TCP/IP Process to Port Mapper Copyright 2000 by Foundstone, Inc. http://www.foundstone.com Pid Process Port Proto Path 600 tcpsvcs -> 7 TCP C:\WINNT\System32\tcpsvcs.exe 600 tcpsvcs -> 9 TCP C:\WINNT\System32\tcpsvcs.exe 600 tcpsvcs -> 13 TCP C:\WINNT\System32\tcpsvcs.exe 600 tcpsvcs -> 17 TCP C:\WINNT\System32\tcpsvcs.exe 600 tcpsvcs -> 19 TCP C:\WINNT\System32\tcpsvcs.exe 1076 inetinfo -> 21 TCP C:\WINNT\System32\inetsrv\inetinfo.exe 1076 inetinfo -> 25 TCP C:\WINNT\System32\inetsrv\inetinfo.exe 972 wins -> 42 TCP C:\WINNT\System32\wins.exe 1036 dns -> 53 TCP C:\WINNT\System32\dns.exe 1076 inetinfo -> 80 TCP C:\WINNT\System32\inetsrv\inetinfo.exe 440 svchost -> 135 TCP C:\WINNT\system32\svchost.exe 8 System -> 139 TCP 1076 inetinfo -> 443 TCP C:\WINNT\System32\inetsrv\inetinfo.exe 8 System -> 445 TCP 600 tcpsvcs -> 515 TCP C:\WINNT\System32\tcpsvcs.exe 8 System -> 548 TCP 492 msdtc -> 1025 TCP C:\WINNT\System32\msdtc.exe 808 MSTask -> 1026 TCP C:\WINNT\system32\MSTask.exe 600 tcpsvcs -> 1029 TCP C:\WINNT\System32\tcpsvcs.exe 1036 dns -> 1034 TCP C:\WINNT\System32\dns.exe 972 wins -> 1036 TCP C:\WINNT\System32\wins.exe 1076 inetinfo -> 1038 TCP C:\WINNT\System32\inetsrv\inetinfo.exe 8 System -> 1041 TCP 8 System -> 1044 TCP 492 msdtc -> 3372 TCP C:\WINNT\System32\msdtc.exe 924 termsrv -> 3389 TCP C:\WINNT\System32\termsrv.exe 1076 inetinfo -> 3940 TCP C:\WINNT\System32\inetsrv\inetinfo.exe 1464 NC -> 62875 TCP C:\InetPub\Scripts\NC.EXE 600 tcpsvcs -> 7 UDP C:\WINNT\System32\tcpsvcs.exe 600 tcpsvcs -> 9 UDP C:\WINNT\System32\tcpsvcs.exe 600 tcpsvcs -> 13 UDP C:\WINNT\System32\tcpsvcs.exe 600 tcpsvcs -> 17 UDP C:\WINNT\System32\tcpsvcs.exe 600 tcpsvcs -> 19 UDP C:\WINNT\System32\tcpsvcs.exe 972 wins -> 42 UDP C:\WINNT\System32\wins.exe 1036 dns -> 53 UDP C:\WINNT\System32\dns.exe 600 tcpsvcs -> 67 UDP C:\WINNT\System32\tcpsvcs.exe 600 tcpsvcs -> 68 UDP C:\WINNT\System32\tcpsvcs.exe 440 svchost -> 135 UDP C:\WINNT\system32\svchost.exe 8 System -> 137 UDP 8 System -> 138 UDP 868 snmp -> 161 UDP C:\WINNT\System32\snmp.exe 8 System -> 445 UDP 248 lsass -> 500 UDP C:\WINNT\system32\lsass.exe 616 svchost -> 1030 UDP C:\WINNT\System32\svchost.exe 616 svchost -> 1031 UDP C:\WINNT\System32\svchost.exe 1036 dns -> 1032 UDP C:\WINNT\System32\dns.exe 1036 dns -> 1033 UDP C:\WINNT\System32\dns.exe 972 wins -> 1035 UDP C:\WINNT\System32\wins.exe 236 services -> 1037 UDP C:\WINNT\system32\services.exe 1076 inetinfo -> 1039 UDP C:\WINNT\System32\inetsrv\inetinfo.exe 616 svchost -> 1645 UDP C:\WINNT\System32\svchost.exe 616 svchost -> 1646 UDP C:\WINNT\System32\svchost.exe 616 svchost -> 1812 UDP C:\WINNT\System32\svchost.exe 616 svchost -> 1813 UDP C:\WINNT\System32\svchost.exe 600 tcpsvcs -> 2535 UDP C:\WINNT\System32\tcpsvcs.exe 1076 inetinfo -> 3456 UDP C:\WINNT\System32\inetsrv\inetinfo.exe
Looking through the data returned from fport, we see a TCP port 62875 opened that seems suspicious because it was opened from an executable called C:\inetpub\scripts\nc.exe. Additionally, we see this process has an ID of 1464. This is something not typically installed on a fresh system, so it deserves further analysis. Here’s something that may seem obvious but it’s worth mentioning: The path and filename of the tool for PID 1464 is suspicious, but the attacker could have named the tool something more innocuous.
| Tip | If you want to sort by port, use the /p switch, which is the default. If you want the output to be sorted by application, the /a switch can be used (you can also use /ap to sort by application path). The /i switch will sort by PID. |
Netstat
Netstat displays the listening and current connections’ network information for the victim machine. This command gives you insight into current connections and listening applications, information that can help you discover nefarious activity and installed backdoors on a victim machine. Netstat can be located at C:\winnt\system32\netstat.exe on a trusted Windows NT or 2000 machine.
Implementation
Use of this tool is quite simple. Type the following command to retrieve the connected IP addresses and all opened port information from the compromised system:
D:\> netstat -an
The -a flag displays all the network information, and -n does not execute the reverse Domain Name System (DNS) lookup for external IP addresses listed in the output.
The following output was captured from the Case Study (at the end of the “Windows Live Response Tool Kit” section) after netstat was executed on the victim machine.
Active Connections Proto Local Address Foreign Address State TCP 0.0.0.0:7 0.0.0.0:0 LISTENING TCP 0.0.0.0:9 0.0.0.0:0 LISTENING TCP 0.0.0.0:13 0.0.0.0:0 LISTENING TCP 0.0.0.0:17 0.0.0.0:0 LISTENING TCP 0.0.0.0:19 0.0.0.0:0 LISTENING TCP 0.0.0.0:21 0.0.0.0:0 LISTENING TCP 0.0.0.0:25 0.0.0.0:0 LISTENING TCP 0.0.0.0:42 0.0.0.0:0 LISTENING TCP 0.0.0.0:53 0.0.0.0:0 LISTENING TCP 0.0.0.0:80 0.0.0.0:0 LISTENING TCP 0.0.0.0:135 0.0.0.0:0 LISTENING TCP 0.0.0.0:443 0.0.0.0:0 LISTENING TCP 0.0.0.0:445 0.0.0.0:0 LISTENING TCP 0.0.0.0:515 0.0.0.0:0 LISTENING TCP 0.0.0.0:548 0.0.0.0:0 LISTENING TCP 0.0.0.0:1025 0.0.0.0:0 LISTENING TCP 0.0.0.0:1026 0.0.0.0:0 LISTENING TCP 0.0.0.0:1029 0.0.0.0:0 LISTENING TCP 0.0.0.0:1034 0.0.0.0:0 LISTENING TCP 0.0.0.0:1036 0.0.0.0:0 LISTENING TCP 0.0.0.0:1038 0.0.0.0:0 LISTENING TCP 0.0.0.0:1044 0.0.0.0:0 LISTENING TCP 0.0.0.0:3372 0.0.0.0:0 LISTENING TCP 0.0.0.0:3389 0.0.0.0:0 LISTENING TCP 0.0.0.0:3940 0.0.0.0:0 LISTENING TCP 192.168.1.103:139 0.0.0.0:0 LISTENING TCP 192.168.1.103:1041 0.0.0.0:0 LISTENING TCP 192.168.1.103:1041 192.168.1.1:139 ESTABLISHED TCP 192.168.1.103:62875 0.0.0.0:0 LISTENING TCP 192.168.1.103:62875 192.168.1.1:2953 ESTABLISHED UDP 0.0.0.0:7 *:* UDP 0.0.0.0:9 *:* UDP 0.0.0.0:13 *:* UDP 0.0.0.0:17 *:* UDP 0.0.0.0:19 *:* UDP 0.0.0.0:42 *:* UDP 0.0.0.0:68 *:* UDP 0.0.0.0:135 *:* UDP 0.0.0.0:161 *:* UDP 0.0.0.0:445 *:* UDP 0.0.0.0:1033 *:* UDP 0.0.0.0:1035 *:* UDP 0.0.0.0:1037 *:* UDP 0.0.0.0:1039 *:* UDP 0.0.0.0:1645 *:* UDP 0.0.0.0:1646 *:* UDP 0.0.0.0:1812 *:* UDP 0.0.0.0:1813 *:* UDP 0.0.0.0:3456 *:* UDP 127.0.0.1:53 *:* UDP 127.0.0.1:1030 *:* UDP 127.0.0.1:1031 *:* UDP 127.0.0.1:1032 *:* UDP 192.168.1.103:53 *:* UDP 192.168.1.103:67 *:* UDP 192.168.1.103:68 *:* UDP 192.168.1.103:137 *:* UDP 192.168.1.103:138 *:* UDP 192.168.1.103:500 *:* UDP 192.168.1.103:2535 *:*
With this information, we see that TCP port 62875 is open, just as we did with fport. Additionally, we see that 192.168.1.1 is currently connected to this port. This tells us that someone may still be on our machine!
| Note | Notice that unlike fport, netstat tells us only which ports are open—not which processes are using them. Sometimes we need to know about the ports only, in which case netstat is a quick and easy solution as it is installed by default on all Windows systems. However, if netstat shows you an open port that you can’t account for, you’ll want to use fport to map that port to a running process. |
You may notice that both IP addresses are within the same local network. You could draw two conclusions from this information: Either the attacker is an “insider,” or the attacker has compromised another machine within your network and is launching attacks from it. Either way, this is not a good scenario!
| Tip | You may want to use the -r switch with netstat, which outputs the current routing table that determines how packets are routed through the victim machine. A resourceful attacker could change the flow of traffic within your network after a machine is compromised, and the -r switch would show you the evidence. |
Nbtstat
Nbtstat, mentioned in Chapter 6, is a NetBIOS tool that is also installed with the Windows operating system. Nbtstat.exe, like netstat, can be located at C:\winnt\system32\nbtstat.exe. Although nbtstat provides a lot of functionality, we are interested in using it to list only the NetBIOS name cache within the victim computer. The NetBIOS name cache will provide a listing of computers that have been connected, via the NetBIOS protocol (that is, via Microsoft Windows File and Print Sharing), within a short time frame—typically less than 10 minutes. If you see machines you do not expect in this list, you may want to perform further investigation, depending on whether the machines are located within or outside your network.
Implementation
Nbtstat is run with the following options for our live response:
D:\> nbtstat -c
The -c switch lists all of the NetBIOS names currently in the victim’s cache. Therefore, if any NetBIOS connections were made between a machine to the victim during the attacker’s actions, it may be seen in nbtstat’s output if it was recent.
The following output demonstrates the results of this command on a victim machine:
Local Area Connection: Node IpAddress: [192.168.1.103] Scope Id: [] NetBIOS Remote Cache Name Table Name Type Host Address Life [sec] ------------------------------------------------------------ FREEBSD 20 UNIQUE 192.168.1.1 190
We can identify no suspicious activity here, as 192.168.1.1 is another trusted system within the network. However, if this server was indeed compromised, it may widen the scope of the investigation if drives were shared between the computers listed in the output.
ARP
The Address Resolution Protocol (ARP) table maps the physical machine—the Media Access Control (MAC)—addresses of the Ethernet cards to the associated IP addresses in the subnet. Because most networks do not secure the local subnet by binding a specific MAC address to an IP address using switches, anyone can modify his or her ARP table or IP address and cause havoc. This occurs, for example, when one employee masquerades as another on the internal network. By using the arp command, you will be able to see (within the last few minutes) which MAC address was mapped to which IP address, and this may help you to track down a rogue user.
The ARP tool is installed with the Windows NT and 2000 operating systems and is located at C:\winnt\system32\arp.exe.
Implementation
The ARP tool will output the contents of the ARP table if the following command is executed:
D:\> arp -a
The following output shows the results of this command on a victim machine:
Interface: 192.168.1.103 on Interface 2 Internet Address Physical Address Type 192.168.1.1 00-bd-e1-f1-01-03 dynamic
The physical address for 192.168.1.1 is discovered to be 00-bd-e1-f1-01-03. We can use this additional piece of evidence for our investigation. If we needed to track down 192.168.1.1 on our network, we would locate the machine with the MAC address of 00-bd-e1-f1-01-03.
| Caution | A user with sufficient privileges can change his or her own MAC (and IP) address in many operating systems. It is possible to do this with any Windows or Unix machine. |
Pslist
Another volatile piece of the puzzle we want to capture is the process table listing. We can do this with the Pslist tool. The process table listing will show us any rogue processes, such as backdoors, sniffers, and password crackers that the attacker may have executed on a system after he has compromised it.
Pslist has numerous features that are useful to a system administrator or software developer, but the functionality we need from this tool is limited to a simple listing of the processes running on the system. Therefore, here we discuss only this facet. Pslist is located at http://www.sysinternals.com and is freely available for download. Please review Chapter 6 for a much larger discussion on PsTools, the suite that contains Pslist.
Implementation
Pslist is simple to use and it is invoked by typing the following command:
D:\> pslist
The following output is the result of this command executed on a victim machine:
PsList v1.12 - Process Information Lister Copyright (C) 1999-2000 Mark Russinovich Systems Internals - http://www.sysinternals.com Process information for VICTIM2K: Name Pid Pri Thd Hnd Mem User Time Kernel Time Elapsed Time Idle 0 0 1 0 16 0:00:00.000 1:51:37.250 1:58:26.698 System 8 8 41 162 136 0:00:00.000 0:00:38.795 1:58:26.698 smss 156 11 6 36 144 0:00:00.050 0:00:01.361 1:58:26.698 csrss 184 13 12 453 1352 0:00:05.818 0:00:39.516 1:58:15.633 winlogon 208 13 15 365 2056 0:00:00.831 0:00:05.898 1:58:13.870 services 236 9 32 555 3420 0:00:01.371 0:00:10.004 1:58:10.956 lsass 248 13 19 304 2252 0:00:00.650 0:00:03.755 1:58:10.816 svchost 440 8 6 230 1328 0:00:00.410 0:00:01.151 1:58:04.156 SPOOLSV 464 8 13 120 1348 0:00:00.330 0:00:01.291 1:58:02.574 msdtc 492 8 20 152 636 0:00:00.130 0:00:01.351 1:58:01.933 tcpsvcs 600 8 18 276 1144 0:00:00.370 0:00:02.423 1:57:59.039 svchost 616 8 20 427 1236 0:00:01.301 0:00:03.695 1:57:58.838 llssrv 640 9 9 97 720 0:00:00.090 0:00:00.510 1:57:58.308 sfmprint 668 8 2 46 600 0:00:00.080 0:00:00.350 1:57:55.554 regsvc 776 8 2 30 456 0:00:00.010 0:00:00.210 1:57:50.526 mstask 808 8 6 89 700 0:00:00.070 0:00:00.410 1:57:48.053 snmp 868 8 6 247 704 0:00:00.260 0:00:01.832 1:57:46.120 termsrv 924 10 12 118 504 0:00:00.080 0:00:00.560 1:57:43.947 wins 972 8 18 260 1096 0:00:00.170 0:00:01.141 1:57:40.502 dfssvc 996 8 2 36 252 0:00:00.050 0:00:00.120 1:57:39.911 dns 1036 8 12 147 552 0:00:00.060 0:00:00.650 1:57:39.140 inetinfo 1076 8 34 697 7584 0:00:02.733 0:00:14.080 1:57:37.898 sfmsvc 1128 8 7 69 164 0:00:00.060 0:00:00.240 1:57:32.831 explorer 1188 8 11 298 2372 0:00:04.296 0:00:33.968 1:56:15.169 VMTBox 1552 8 2 26 520 0:00:05.417 0:00:00.590 1:56:08.299 mdm 1560 8 3 75 1248 0:00:00.090 0:00:00.460 1:55:50.123 dllhost 948 8 25 307 5500 0:00:02.453 0:00:02.293 1:55:24.947 dllhost 1612 8 10 127 1440 0:00:00.791 0:00:02.082 1:55:23.876 cmd 1712 8 1 24 1132 0:00:04.246 0:01:17.892 1:35:34.786 NC 1464 8 3 158 1364 0:00:00.030 0:00:00.300 0:13:14.352 cmd 352 8 1 136 940 0:00:00.020 0:00:00.110 0:07:01.235 PSLIST 1788 8 2 98 1264 0:00:00.020 0:00:00.210 0:00:00.330
In the results, we see that NC was running as process 1464. Because we saw the path within the fport output earlier, we become suspicious. The system administrator does not typically place Netcat in a directory that is accessible from the web server (C:\inetpub\scripts). Therefore, this process warrants further investigation, or perhaps we will want to kill it all together. This is the only process we see that is suspicious in the Pslist output.
kill
If we wished to kill process 1464 because we saw the attacker connected to it (from the netstat output), we could easily do that with the kill command. The kill command comes packaged with the Windows NT or 2000 Resource Kit distributed by Microsoft.
Implementation
The command is run in the following manner:
D:\> kill <pid>
We are not recommending that you run kill at this stage, as you may want to perform network surveillance with tools such as tcpdump, WinDump, or Ethereal. (For a complete discussion of these network monitors, see Chapter 16.) However, sometimes the "powers that be" require that the system be immediately "repaired." It is your choice whether or not to run this command and kill the suspicious process.
dir
The directory (dir) command is not an actual program that you can copy over to the live response CD. It is a command that is interpreted in the shell (cmd.exe) program. This section will supply you with the command-line options you need to collect the last accessed, last modified, and created timestamps from the files on the victim machine.
Because you want to capture all the information about the victim machine that is most volatile to least volatile, you will acquire the last access timestamps first. Then you will capture the last modified timestamps, followed by the creation date. We recommend executing this command close to the beginning of your response so that you have a good set of timestamps in case they are changed within your response plan.
| Tip | Be sure to capture the timestamps as early as possible because it may be the only good copy you can acquire. For instance, if a file is inadvertently accessed during the response, you can always go back to the timestamps you acquired in the beginning. |
Implementation
The last accessed time and date stamps can be retrieved with the following command that will sort the time and date stamps and also perform a recursive directory listing, accessing all the files on the system. It’s a good idea to run this as an administrator so that you are sure that you have access to all the files on the hard drive.
D:\> dir /a /t:a /o:d /s c:\
The /a switch will list all files, even hidden ones. The /t switch tells dir which timestamp you want to see. In this case, a signifies the last accessed times. The /o:d switch tells the command you want the output to be sorted by date. The /s switch performs a recursive file listing (that is, it “crawls” your file system). The command shown here captures only the timestamps from your C: drive. If you have more than one drive on your machine, you will want to run the commands more than once, changing the drive letter appropriately.
A fragment of the relevant, last accessed, timestamps from the victim machine is listed here:
Directory of c:\Inetpub\scripts 03/21/2002 01:20p 471 upload.asp 03/21/2002 01:20p 5,683 upload.inc 03/21/2002 01:21p 35,600 KILL.EXE 03/21/2002 01:22p 61,440 1.exe 03/21/2002 01:23p DIR .. 03/21/2002 01:23p DIR . 03/21/2002 01:24p 120,320 NC.EXE 5 File(s) 223,514 bytes
Similarly, the last modified time and date stamps can be retrieved with the following command:
D:\> dir /a /t:w /o:d /s c:\
A fragment of the relevant, last modified, timestamps from the victim machine is listed here:
Directory of c:\Inetpub\scripts 03/21/2002 01:20p 471 upload.asp 03/21/2002 01:20p 5,683 upload.inc 03/21/2002 01:21p 120,320 NC.EXE 03/21/2002 01:21p 35,600 KILL.EXE 03/21/2002 01:22p DIR .. 03/21/2002 01:22p DIR . 03/21/2002 01:22p 61,440 1.exe 5 File(s) 223,514 bytes
Lastly, the creation time and date stamps can be retrieved with the following command:
D:\> dir /a /t:c /o:d /s c:\
A fragment of the relevant, created, timestamps from the victim machine is listed here:
Directory of c:\Inetpub\scripts 03/21/2002 10:19a DIR .. 03/21/2002 10:19a DIR . 03/21/2002 01:20p 471 upload.asp 03/21/2002 01:20p 5,683 upload.inc 03/21/2002 01:21p 120,320 NC.EXE 03/21/2002 01:21p 35,600 KILL.EXE 03/21/2002 01:22p 61,440 1.exe 5 File(s) 223,514 bytes
Notice the new programs in C:\inetpub\scripts\ that were presumably not there earlier. These files could be transferred to the forensic workstation and tool analysis could then be performed on them to determine their functionality.
Auditpol
auditpol is one of the commands that could determine the next commands you execute on the system. Auditpol lists the system auditing policy on the local system when it is executed without any parameters. If the auditing policy is not enabled or is not set correctly, the next few commands will not produce anything useful for the investigation. Auditpol can be located in the Windows NT and 2000 Resource Kits distributed from Microsoft.
Auditpol has many more functions, such as modifying the policy, that are not discussed within this section but that could be useful to a system administrator. Here, we will feature the command’s ability to view the audit policy.
| Tip | Be sure that you have the correct version of auditpol installed for the victim machine. Windows NT’s auditpol is not accurate for a Windows 2000 machine because the two different operating systems do not have the same auditing characteristics. |
Implementation
To execute auditpol, type the following command:
D:\> auditpol
The next output shows the results when auditpol was executed on the victim machine:
Running ... (X) Audit Enabled System = No Logon = Success and Failure Object Access = No Privilege Use = Success and Failure Process Tracking = No Policy Change = Success and Failure Account Management = Success and Failure Directory Service Access = No Account Logon = Success and Failure
Auditpol tells us whether auditing is enabled on the system as well as any individual items that are being audited. Notice that on our victim machine, auditing was enabled. Furthermore, the victim machine is auditing individual items. Since the logons/logoffs were enabled, we will be able to run the next few commands (loggedon and ntlast) to determine whether any interesting information is returned. If we were to discover that auditing were disabled, we would not want to bother with the dumpel command for the security log.
Loggedon
It is always beneficial to see who is currently logged onto the victim machine. Perhaps the mode of entry was not through the web server, but rather over NetBIOS. The Loggedon tool will supply that information. Loggedon can be obtained from http://www.sysinternals.com.
Implementation
Loggedon is simple to use. To use it in a live response scenario, type the following command:
D:\> loggedon
The following script shows the information obtained from our Case Study at the end of the “Windows Live Response Tool Kit” section. Notice how the only person logged onto the system locally or remotely is Administrator. In this Case Study, our system has the NetBIOS name of VICTIM2K.
LoggedOn v1.1 - Logon Session Displayer Copyright (C) 1999-2000 Mark Russinovich SysInternals - www.sysinternals.com Users logged on locally: VICTIM2K\Administrator No one is logged on via resource shares.
| Note | Even though you do not see other users logged on with this tool, it doesn’t mean that someone is not accessing your system. Loggedon notes only the proper login sequences. If someone were to backdoor the system, the information would not be presented with this tool. |
NTLast
Of course it is nice to know who is currently logged on, but if a perpetrator is not currently active on the system but has logged in previously, using only Loggedon won’t tell us this information. To determine this information, we can use a tool called NTLast, written by J.D. Glaser of Foundstone, Inc. NTLast can be freely downloaded from http://www.foundstone.com.
| Note | This tool checks for the logon and logoff events and reports them when it is executed. Therefore, these events must be audited, and that is why we checked with auditpol first. |
Implementation
To view successful logins, NTLast is run with the -s switch, as shown here:
D:\> ntlast -s
To view failed logons, use the -f switch:
D:\> ntlast -f
The tool reports the time, date, account name, and initiating NetBIOS name of successful or failed logons, depending on the switch you use.
For the Case Study at the end of the “Windows Live Response Tool Kit” section, we ran this command and received the following information for successful logins:
Administrator VICTIM2K VICTIM2K Thu Mar 21 08:20:33pm 2002 Administrator VICTIM2K VICTIM2K Thu Mar 21 12:03:46pm 2002 Administrator VICTIM2K VICTIM2K Thu Mar 21 11:03:12am 2002 Administrator VICTIM2K VICTIM2K Thu Mar 21 10:12:55am 2002
No information was pertinent to our Case Study.
Dump Event Log (dumpel)
The only tool installed with basic Windows NT or 2000 systems to view the system event logs is the Event Viewer. This is a GUI tool, and a GUI tool should not be run during a response because GUI tools touch numerous system files on the victim hard drive, therefore changing time and date stamps.
Perhaps the best method for retrieving system event logs is to use the Dump Event Log command-line tool. This tool dumps the event logs in a human-readable format for offline analysis. This format can then be imported into a spreadsheet and sorted for specific events. Dumpel is packaged with the Windows NT and 2000 Resource Kits, or it can be downloaded separately at http://www.microsoft.com/windows2000/techinfo/reskit/tools/existing/dumpel-o.asp.
Implementation
Three logs for system events are maintained in the Windows NT and 2000 operating systems:
-
The System Event Log
-
The Application Event Log
-
The Security Event Log
These system event logs are stored in a proprietary format and, therefore, cannot be read easily (if at all) when the victim machine is offline. However, you can use dumpel to retrieve all three of these logs from a live system. The following command will retrieve the system log:
D:\> dumpel -l system
This command will dump the application log:
D:\> dumpel -l application
This command will dump the security log:
D:\> dumpel -l security
In our Case Study at the end of the “Windows Live Response Tool Kit” section, the logs shown in Figures 20-1 to 20-3 were retrieved using dumpel. After reviewing the three logs, we determined that no information pertinent to this incident appears.
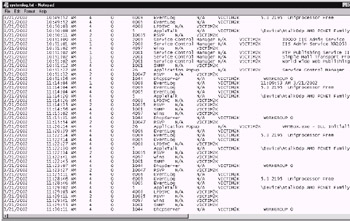
Figure 20-1: The System Event Log from Dumpel
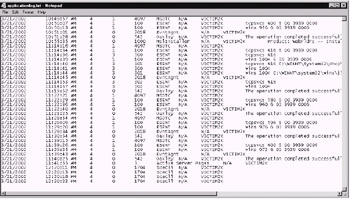
Figure 20-2: The Application Event Log from Dumpel
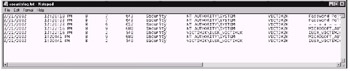
Figure 20-3: The Security Event Log from Dumpel
Regdmp
You can consider the registry one large logging facility, because it contains all the information about a particular installation of Windows and other installed programs. This information could be useful to the investigator and could supply additional leads such as the following:
-
The last few places the machine connected to with the telnet client
-
The last few most recently used (MRU) documents for each program
-
The executables started when the machine is booted (Trojans typically modify the registry)
The registry is kept in proprietary formats on the hard drive and is difficult to retrieve when the system is not running unless commercial forensic tools are used. However, you can use the Regdmp tool to dump the registry contents in human-readable form. Regdmp is packaged with the Windows NT and 2000 Resource Kits.
Implementation
The following command will dump the entire contents of the registry on the local system:
D:\> regdmp
In our Case Study at the end of the “Windows Live Response Tool Kit” section, Regdmp was used to dump the registry, which was then transferred to the forensic workstation. The following output shows a fragment of the registry dumped by Regdmp:
\Registry Machine [17 1 8] HARDWARE [17 1 8] DESCRIPTION [17 1 8] System [17 1 8] Component Information = REG_BINARY 0x00000010 0x00000000 0x00000000 0x00000000 0x00000000 Identifier = AT/AT COMPATIBLE Configuration Data = REG_FULL_RESOURCE_DESCRIPTOR 0x00000054 0xffffffff 0xffffffff 0x00000000 0x00000002 0x00000005 0x0000000c 0x00000000 0x00000000 0x03f50080 0x003f0000 0x0002001f 0x00000005 0x00000018 0x00000000 \ 0x00000000 0x000c0000 0x00008000 0x000e0000 0x00010000 0x000f0000 0x00010000 ; Partial List number 0 ; INTERFACE_TYPE Undefined ; BUS_NUMBER -1 ; Descriptor number 0 ; Share Disposition CmResourceShareUndetermined ; TYPE DEVICE SPECIFIC
As you can see, the contents are in plain text, so the information can be searched with any appropriate type of tool.
| Tip | When you search the registry, it is usually a good idea to do it within WordPad and to make sure any searches for keywords are done with case insensitivity turned on. |
SFind
Attackers can hide their tools on an NTFS via a mechanism known as file streaming. When the tools are hidden in this manner, the files they are hidden behind do not change in size. Therefore, if a forensic duplication is not performed of the victim machine, SFind should be run on it after the directory commands have been executed to acquire the three timestamps. When run, SFind will locate any streamed files and report them to the console. SFind is freely distributed from Foundstone, Inc., and can be downloaded at http://www.foundstone.com.
| Caution | SFind can produce unpredictable results when run on Windows 2000. The executable never finishes and does not detect streamed files. |
Implementation
The following command will locate streamed files on the C: drive:
D:\> sfind c:\
If any streamed files are located, they will be reported. Typically, we would not send this information to the destination (forensic) workstation. If streamed files are found, however, we transmit the streamed files to the forensic workstation for further analysis.
Md5sum
After all the information has been transferred to the forensic workstation, it is a good idea to get the MD5 checksums of the results. Md5sum is distributed with the Cygwin package and can be downloaded at http://www.cygwin.com. Please see Chapter 3 for a further discussion on Cygwin.
Implementation
The following command will calculate the MD5 checksum of the output files and save them in a file called md5sums.txt on the destination (forensic) workstation:
C:\incident1\> md5sum -b * > md5sums.txt
| Note | md5sums.txt will not have its correct MD5 checksum reported within itself and will always be mismatched from its true MD5 checksum. This is because the file is being written to as md5sum is calculating the checksum. |
Let's examine the case of a Windows 2000 web server that was left unprotected on the Internet. It is a typical web server with some static content left unattended by the system administrator until an extortion e-mail showed up in the webmaster's e-mail account. And, like most hacks today, it was believed that the hack occurred over TCP port 80 (HTTP), because 80 was the only inbound port allowed by the protecting firewall.
Of course, your CEO does not believe that your company was attacked and wants you to help verify the implications of the extortion e-mail before the proper resources are poured into a full-blown investigation. (Note that in a full-blown investigation, you would be performing forensic duplications, as discussed in the upcoming chapters.) In short, you will be performing an internal investigation before law enforcement is contacted. Because your company decided it will contact law enforcement if an attack is found, you must be sure that you collect the data in a forensically sound manner so that it can be turned over to officials.
Being the savvy investigator that you are, you come steaming into the room armed with your live response tool kit on CD-ROM. Most of the programs in your live response tool kit are command-line tools. Therefore, because you want to conduct a forensically sound investigation (because this could be The Big One!), you save the output of these commands somewhere other than the compromised machine. By saving the data to external media or to another machine, you minimize changes to the hard disk of the victim machine and can therefore potentially recover more data in the forensic duplication process—if you choose that route. To save this information to another machine, you use Netcat/Cryptcat to transfer the information across the network. To accomplish this task, you type the following on the destination workstation first:
C:\> nc -l -p <Dest. Workstation Port> > <command>.txt
You know that you have two choices for connecting your destination workstation to the source machine: via the live network or via crossover cable. If you choose to use the live network, you know that the attacker may attempt to attack your destination workstation. So you've already taken the proper precautions to secure the forensic workstation before you attach it to the live network.
On the source machine, after you've executed a trusted command shell, you type the following:
D:\> <command> | nc <Dest. Workstation IP> <Dest. Workstation Port>
After the information is transferred, both sides of the connection seem to “hang.” When you are sure the process is complete on the source machine (the title of the trusted cmd.exe window returns to “CMD”), you press CTRL-C.
This transfers the output of the command <command> over the network and saves the results in the current directory on the forensic workstation as <command>.txt.
You decide to script your efforts because you see that this will take a lot of walking back and forth between machines. You use the following batch file, named response.bat, to run all the commands you need and output them to the destination:
@@@echo off echo ********************** echo ***** Start Date ***** echo ********************** echo. | date echo ********************** echo ***** Start Time ***** echo ********************** echo. | time echo *********************** echo ***** netstat -an ***** echo *********************** netstat -an echo ****************** echo ***** arp -a ***** echo ****************** arp -a echo ***************** echo ***** fport ***** echo ***************** fport echo ****************** echo ***** pslist ***** echo ****************** pslist echo ********************** echo ***** nbtstat -c ***** echo ********************** nbtstat -c echo ******************** echo ***** loggedon ***** echo ******************** loggedon echo ****************** echo ***** ntlast ***** echo ****************** ntlast echo ******************************* echo ***** Last Accessed Times ***** echo ******************************* dir /t:a /o:d /s c:\ echo ******************************* echo ***** Last Modified Times ***** echo ******************************* dir /t:w /o:d /s c:\ echo ************************** echo ***** Creation Times ***** echo ************************** dir /t:c /o:d /s c:\ echo ****************************** echo ***** Security Event Log ***** echo ****************************** dumpel -l security echo ********************************* echo ***** Application Event Log ***** echo ********************************* dumpel -l application echo **************************** echo ***** System Event Log ***** echo **************************** dumpel -l system echo ******************** echo ***** ipconfig ***** echo ******************** ipconfig /all echo ******************** echo ***** End Time ***** echo ******************** echo. | time echo ******************** echo ***** End Date ***** echo ******************** echo. | date
The source (victim) machine in this scenario has the IP address 192.168.1.103, and the destination (forensic) workstation is 192.168.1.10. To use this script, you type the following command on the source machine:
D:\> response.bat | D:\nc 192.168.1.10 2222
To receive the data, you execute the following command on the destination workstation:
C:\> nc -l -p 2222 response.txt
(The authors used the output from the victim machine as the examples throughout this chapter. Therefore, the following sections iterate the importance of each tool for this scenario.)
Fport Fport was the first tool to show you that C:\inetpub\scripts\nc.exe was listening on TCP port 62875. This gave you the path, port, and PID (1464) of the backdoor that the attacker established.
Netstat Netstat provided you with the network connection information and the possible attacker's IP address of 192.168.1.103. You saw that the attacker was currently on the system as you were performing your response.
dir Issuing the dir command showed you that the files 1.exe, upload.asp, upload.inc, kill.exe, and nc.exe were uploaded to the system in the directory C:\inetpub\scripts. By reading the created timestamps, you see that the files were created on March 21, 2002, at approximately 1:20 P.M. The created timestamps tell you when the system may have been successfully attacked (this is a good time/date to check with your IDS and firewall logs). The last access timestamps tell you the last time these files were executed, or perhaps the last time the attacker was on the system.
Now you form a conclusion about your investigation. Because of the pertinent information you found with your live response, you assume that the attacker does have a foothold into your network. Therefore, you report back to your CEO that the evidence concludes an attacker has gained unauthorized access to the Windows 2000 web server and to your company's network. Time to call in the authorities!
|
| < Day Day Up > |
|
EAN: 2147483647
Pages: 189