Models
Models are valuable only to the extent that they facilitate communication among human beings. (A model that can be understood by a computer is a programming language.) This implies that the effort required to construct the model must be less than the communication value that arises from its use. The dramatic failure of CASE can be traced almost entirely to the fact that the effort required to learn and use the tools far exceeded the ability of resultant models to facilitate communication.
Unfortunately, a learning curve and some degree of overhead will always be associated with the use of any set of models and any automated tool supporting the construction of those models. It s the balance between benefit and cost that s critical in determining whether models and tools will be useful. [12] In that spirit, none of the following are essential in the sense that you cannot do object thinking without them. None of the models have fixed syntax or content ”what is presented is suggestive. All of the models can and should be simplified as the developer internalizes object thinking skills ”until, as with the Cheshire cat, only the model s smile remains to evoke the knowledge in the head of the developer and of the development team.
Semantic Net
A semantic net consists of little more than nodes, arcs, and text labels (see Figure 6-3), with nodes representing things and arcs representing relationships among those things. Nodes are labeled with a noun or noun phrase and relationship arcs with a verb or verb phrase.
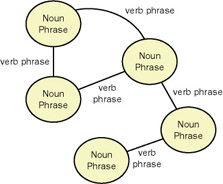
Figure 6-3: A semantic net, a brainstorming tool for discovery of potential objects in a domain.
A semantic net can be useful to jump-start a discussion of objects in the same way that underlining nouns and verb phrases in a written problem description. In both cases you are attempting to quickly identify potential objects and typical ”in the domain ”interactions among those objects. The primary utility of a semantic net is to serve as a brainstorming tool that can be used by a group of people simultaneously . (A good- size whiteboard is very useful.) The model produced need not persist beyond the point when the objects, responsibilities, and constraints identified have been transferred to other models (such as the object cube). The LIMT sidebar illustrates a typical use of a semantic net.
| |
The Legislature has created a $2 billion dollar fund ”the LIMT ”to help young couples acquire a home they ordinarily could not afford. Mortgages are granted to qualified couples. The trust subsidizes monthly mortgage payments when necessary, collects payments, and invests whatever capital is not tied up in mortgages.
To qualify for a mortgage:
-
A couple must have been married at least 1 year but not more than 10 years .
-
Both spouses must be gainfully employed. At the time of application, proof must be submitted of full-time employment for at least 48 of the previous 52 weeks.
-
The couple meets the LIMT definition of financial need by meeting one or both of the following requirements:
-
Installments on a fixed-rate 30-year 90 percent mortgage for a qualified home exceed 28 percent of their combined gross income.
-
They lack sufficient savings to pay 10 percent of the cost of the qualifying home plus $7,000 (the estimated closing costs).
-
A mortgage may be issued to qualified couples if
-
The price of the home to be purchased is below the published median price of homes in its area for the past 12 months.
-
The price of the home to be purchased is less than $150,000.
-
LIMT has sufficient funds to purchase the home.
LIMT calculates weekly its pool of available mortgage funds as follows :
-
Expected annual income from investments is calculated and divided by 52.
-
Expected annual operating expenses are calculated and divided by 52.
-
Total income from weekly mortgage payments is calculated.
-
Total of expected payment grants is calculated.
-
Pool amount is then equal to line 1 plus line 3, less line 2 plus line 4.
-
If the cost of homes to be purchased is less than the amount calculated in line 5, LIMT is deemed to have sufficient funds.
-
Unspent funds each week are invested.
If a mortgage is granted, the couple must
-
File an annual copy of their income tax form to confirm preceding -year income.
-
Submit copies of pay slips to confirm monthly gross income each week.
-
Make weekly payments on the mortgage as calculated. Payment amount may vary from week to week.
Weekly payments are calculated as follows:
-
Capital repayment is 1/1560 of the purchase price of the home.
-
Interest payment is 1/52 of 4 percent of the current mortgage balance.
-
Escrow payment is 1/52 of the sum of the annual property tax and the homeowner s insurance premium.
-
Total mortgage payment is the sum of lines 1 through 3.
-
The couple will pay a maximum of 28 percent of their weekly gross income. If the mortgage payment calculated exceeds the 28 percent limitation, a payment grant for the amount of the difference between the mortgage payment and the income limitation is provided by LIMT. This grant amount is not added to the outstanding debt.
Processing requirements are as follows:
-
All data requirements must be updatable.
-
Annual return on investments is updated frequently by the brokerage firm.
-
Expected expenses are updated quarterly.
-
Available funds are computed every week. A report is printed showing the computation details and results.
-
A listing of all or a selected subset of investments is printed on demand.
-
A listing of all or a selected subset of mortgages is printed on demand.
-
Weekly mortgage payment notices (with payment grant amounts where applicable ) are sent to mortgagees following calculation of the mortgage payment and payment grant amounts.
The required reports and queries are as follows:
-
List of mortgages by specified price range
-
List of past-due mortgage payments, with indication of which are fewer than 7 days, 8 to 14 days, 15 to 21 days, 22 to 28 days, and more than 29 days late
-
List of total grant amounts by month
-
Status of specified account
-
Combined details of mortgage application, mortgage information, and payment details
Figure 6-4 shows a semantic net based on the foregoing example. Remember that this is not intended to be correct or complete. A semantic net is a brainstorming tool, and one rule of brainstorming is to record everything, even if wrong, and save analysis and criticism for later. There will be nodes and connections on the net that will require clarification and modification. For example: a couple does not really have an employer ”only individuals do, so it will eventually be necessary to indicate that a couple consists of individuals and individuals have an employer. Directed arcs ”arrows ”would definitely improve the readability of the semantic net, and you are encouraged to use them in flagrant violation of the syntactic specification for such a net. (Be more daring yet: if the relationship seems bilateral, use a double-headed arrow.)
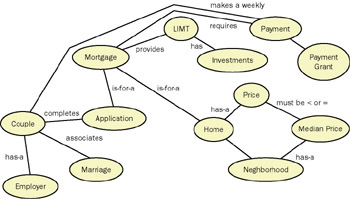
Figure 6-4: Semantic net for the LIMT example.
| |
Object Cubes
An object cube is derived from the CRC card as invented by Beck and Cunningham and elaborated by Wirfs-Brock (particularly stereotypes). Object cubes offer single, consistent, metaphor- preserving model objects. The model is used to aid thinking about decomposition as well as design and some aspects of implementation. Each of the six sides of the cube, illustrated in Figure 6-5 through Figure 6-10, captures one critical aspect of the conceptualization of an object.
-
Side 1 (class, responsibilities, collaborations, the classic CRC card) contains the name of the class to which the object being modeled is an instance, a list of its responsibilities, and identification of any required collaborators.
-
Side 2 includes a text description of the nature of the objects represented by the class. Stereotypes (as defined by Wirfs-Brock) should be included on this side and any notations helpful for implementation.
-
Side 3 provides a list of named contracts, the most common of which will be public , private , and protected . Contracts [13] are intended to reveal the intent of the class creator as to who should be able to send particular messages. Some programming languages enforce this intent (Java), and others do not (Smalltalk). Each contract lists the messages (entire signature or just the selector) that should be included in that contract.
-
Side 4 identifies the discrete pieces of information that an object will require if it is to fulfill its assigned responsibilities. Each piece of information is given a descriptive label, a code indicating the source of the knowledge, and the name of the class that will embody or contain that knowledge.
-
Side 5 lists all of the messages that an object agrees it will respond to. Each message listed here will identify the message selector, or message name; indicate whether any arguments are required (and if so, the class of each argument); and identify the class of the object returned in response to the sending of the message.
-
Side 6 names and describes any events (changes in the state of an object) that other objects might want to be made aware of.
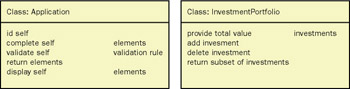
Figure 6-5: The classic CRC card view of an object (LIMT example).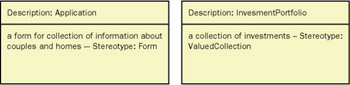
Figure 6-6: Object description and stereotype (LIMT example).
Figure 6-7: Contracts: categories of methods or responsibilities (LIMT example).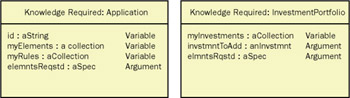
Figure 6-8: Knowledge required by an object (LIMT example).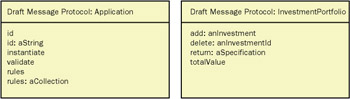
Figure 6-9: Message protocol.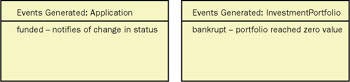
Figure 6-10: Events generated by an object.
Interaction Diagram
Interaction diagrams are versatile: they re used to aid discovery as well as to capture implementation specifications. They model the communication among a group of objects engaged in a particular task. Most behavioral object thinkers employ the term scenario for interaction diagrams or a nested set of such diagrams. Each scenario is bounded by a precondition (what must be true and what message must be sent to initiate the scenario) and a postcondition (what is to be returned when the scenario completes normally). Figure 6-11 illustrates the syntactic components of an interaction diagram. Figure 6-12 uses the syntactic elements of Figure 6-11 to capture a specific conversation ”filling in and validating an application for a mortgage.
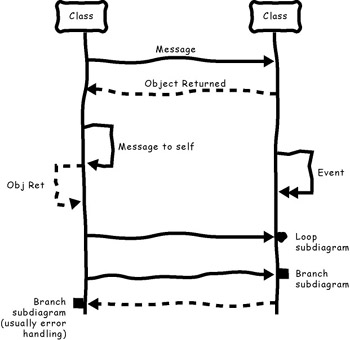
Figure 6-11: In this set of symbols from an interaction diagram, symbols whose labels appear in italics are additions to standard UML.
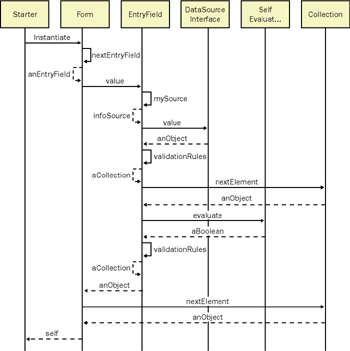
Figure 6-12: This interaction diagram illustrates the conversation required to fill in and validate a mortgage application.
Use cases, as advocated by Jacobson, are a nested set of scenarios (interaction diagrams) whose precondition and postcondition are defined by a single exchange between a user role and the target system.
A text equivalent of an interaction diagram (see Figure 6-13) is a simple table with the preconditions and postconditions noted as headers and columns named Client, Request, Server, Object Returned, and Comments. The Client, Server, and Object Returned columns contain text labels for objects. The Request column contains a text description of the request. It will eventually map to a message sent to the server by the client. The Comments column contains any explanatory text or commentary found to be useful.
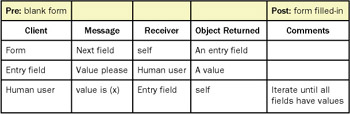
Figure 6-13: Text-only equivalent of the previously modeled interaction diagram.
A still simpler form (see Figure 6-14) can capture the same information as a top-level use case diagram: the requests and responses between a user role and the system. These might also be used to exhaustively list all requests that might be made by one object of exactly one other object. The model has a header that identifies the Client object and the Server object. Columns are available for listing the requests that the client makes, the object returned as a result of a given request, and comments.
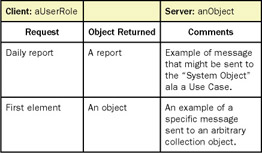
Figure 6-14: This text-only binary use case model captures the same information as a top-level use case diagram.
These models are useful in defining the high-level responsibilities of an application in the same way as a traditional context diagram (one system bubble, several external entities, and connecting arcs labeled with highly generalized data flows) or a graphical use case model (one system bubble with stick figures representing user roles, and connecting arcs labeled to reflect generalized requests and responses). The intent is to define user/system interactions at a high-enough level of abstraction to ensure discovery of an exhaustive list. This type of model might also be used in cases in which an exhaustive list of potential interactions between two objects is required. I have seen this type of use in a medical device specification.
It is unlikely that you would use binary use case models to capture all interactions in a system. The number of models required to do so is n! ( n factorial), where n is the number of objects in your system. Even simple systems would require a huge number of binary use cases to capture all possible interactions. Most developers will reserve the use of this particular model to capturing interactions with objects or systems external to your immediate development focus, or to low-level interactions among a subset of objects involved in critical conversations ”wherein every possible interaction must be identified and dealt with appropriately.
Static Relation Diagram
The static relation diagram is probably the most familiar to any software developer of all the models presented here. Static relation diagrams depict relationships, relatively static in nature, among a group of classes. Here are three common examples and their uses:
-
Class hierarchy A simple diagram showing a single relationship: is-a- kind-of . The root (topmost class) of the hierarchy is labeled, by convention, Object . Many class hierarchy diagrams will be focused on a subset of an entire domain and might not have Object as root. Figure 6-15 is an example of a class hierarchy diagram.
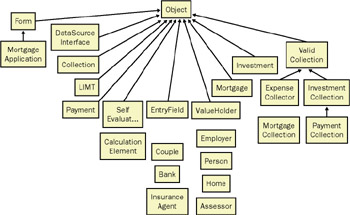
Figure 6-15: A class hierarchy diagram showing single inheritance only. -
Gestalt map The most appropriate use of such diagrams is to provide an overview, or gestalt, of a system or an application while minimizing the amount of detail. A semantic net is a simple example of a gestalt map. Gestalt maps, an example of which is shown in Figure 6-16, provide a convenient shared reference point that reminds developers of the objects involved in an application and important ways in which they are related . Some very common types of relationships captured on a gestalt map include is-a-part-of, is-a-collection-of, is- composed -of, uses, coordinates, associates , and is-a-kind-of. (These types of relationships often have their own graphical syntax representation instead of requiring a text label.) Notice the absence of labels such as Manages or Controls , relationships that should not exist from an object thinking point of view. Decorations and annotations added to a gestalt map enable the capture of constraints or business rules.
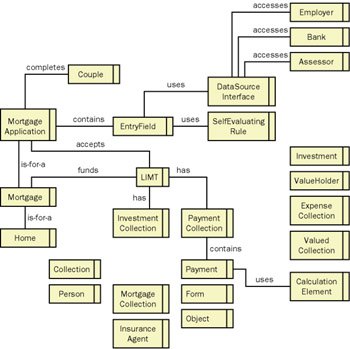
Figure 6-16: A gestalt map provides an overview of the objects and their static relationships.
The more you add special annotations and decorations to the syntax of a gestalt map, the more likely you are to abuse its intent by showing too much detail. A gestalt map is not a set of blueprints, using the analogy of a building; it s the 3-D model that shows what the building will look like in its planned setting without the minute details.
In Chapter 10, a very different kind of gestalt map, an evocative map, is introduced. This kind of gestalt map is more appropriate for XP development because it doesn t fall into the trap of being exhaustively representational.
-
Collective memory map A specialized static relation that shows how knowledge is distributed among a community of objects and that provides structural and definitional metadata relevant to that knowledge. Specifically, it notes the distribution of objects ”stored in instance variables of other objects ”whose primary purpose is to represent some piece of data (strings, numbers , dates, or the like). Special-purpose structures ”for example, valueHolders (a simple indexed collection, with each element consisting of a label and a value associated with that label) ”are composed entirely of these data representation objects. Any constraints and relationships that exist among this subset of objects are noted on this diagram. The most typical examples of such constraints or relationships are analogous to the key/foreign key relationships found in a standard relational data model and to class (type) or value domains typically defined in data dictionaries or schemas. Figure 6-17 shows a collective memory map.
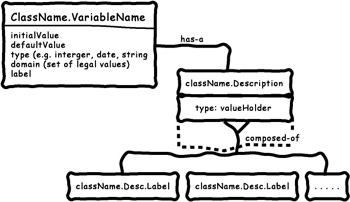
Figure 6-17: A collective memory map, a static view of the data in a system.
Collective memory maps constitute a nod to anyone deeply concerned with data representations and who miss their entity relation diagrams. The utility of these diagrams is easily overstated, and judicious and conservative use is encouraged.
Object State Chart
David Harel revolutionized state modeling with his state charts . Almost all object modelers now use at least a subset of his notation to capture state-dependent information about objects. A typical subset of Harel state chart notation is shown in Figure 6-18.
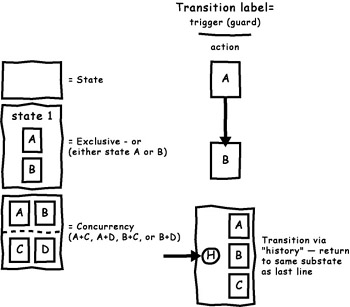
Figure 6-18: The most commonly used symbols borrowed from Harel.
Properly defined and designed, most objects will have an exceedingly simple state. Therefore, the use of this kind of diagram to model object state is seldom required. Object state charts are extremely useful for modeling state-driven interactions among objects, such as the interactions that occur in a typical GUI.
I d like to conclude this chapter by repeating one of the caveats presented at the beginning: no tool has any value other than to assist in object thinking and to provide a means for interpersonal communication. If you can model your objects and your scenarios in your head while engaged in writing code, and if those mental models are consistent with object thinking, great! No need to write them down. If you and your colleagues use a visual model on a whiteboard as an aid in talking about scenarios and in clarifying your collective thinking about those scenarios, and you erase the board when you re done meeting, also great! If your models are crudely drawn and use only a subset of the syntax defined here (or a completely different syntax that you and your colleagues collectively agree upon), still great! Model when you must, what you must, and only what you must.
[12] Booch clearly recognized that developers had an upper limit on the amount of time they were willing to expend learning a method or syntax. He advocated the use of a subset of his full modeling set, called whimsically Booch Lite, as the kernel that was most useful most of the time.
[13] Historically, contracts could be used to aggregate messages by the class of potential senders. Contracts can also be used to reflect the method categories that appear in some IDE browsers for some languages. Care should be taken in this case to avoid contracts that are language or programming tool specific.
EAN: 2147483647
Pages: 88