Section 11. Critical Path Analysis
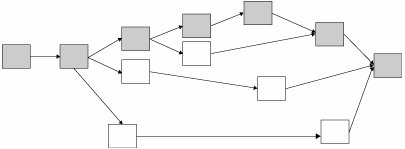
11. Critical Path AnalysisOverviewCritical Path Analysis in Lean Sigma is a simplified version of the tool originating from Project Management. It is primarily used in Rapid Changeover, but is applicable to any complex system of process steps to minimize Process Lead Time. The basis of the tool in Project Management is the network diagram (sometimes known as a PERT Chart), which is a structured graphical representation of the tasks in a project. In Lean Sigma this is completely analogous to the steps in a detailed Process Map representing the activities in a process. The network diagram is structured on the premise that every task must have at least one successor and one predecessor. It is possible, therefore, that tasks can be conducted in parallel as in Figure 7.11.1. Figure 7.11.1. Simple network diagram rules. After all the tasks are connected, the structure is to that shown in Figure 7.11.2. The Critical Path is defined as the longest chain of time through the network (as shown in grey). The Critical Path is so called because any time lost on it is lost on the project (or process) as a whole. In terms of Process Improvement, any opportunities for reduction of the Process Lead Time should center on the Critical Path, particularly in removing NVA activity. Figure 7.11.2. Network diagram. RoadmapThe roadmap for applying Critical Path Analysis is as follows:
Figure 7.11.3. Example Critical Path Analysis applied to an extruder changeover (output in Microsoft™ Project 2000).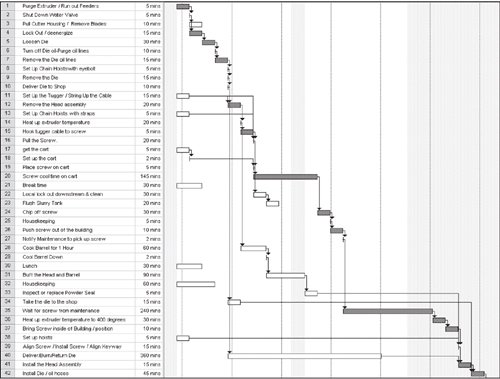 Interpreting the OutputAfter the Gantt Chart is complete with the Critical Path highlighted, it gives focus for the Team to make reductions in the Process Lead Time. On the Critical Path the Team should strive to
Off the Critical Path strive to free up resources by eliminating or reducing activities. |

EAN: 2147483647
Pages: 138