Using the Debugger
| The .NET framework includes a visual debugger that enables you to step line-by-line through the statements of an executing ASP.NET page. You can use the debugger to create breakpoints and watches, to view the values of variables at any point during page execution. In the following sections, you learn how to set up the debugger and create breakpoints and watches . NOTE The debugger included with the .NET framework is the same as the debugger included with Visual Studio .Net, except that the .NET framework debugger is missing some features. For example, the .NET framework debugger does not support remote debugging. Attaching the DebuggerBefore you can use the debugger, you must place your ASP.NET application in debug mode. The debugger requires the extra symbol information generated in debug mode to associate executing statements with the appropriate source code. To place your application in debug mode, include the Web.Config file in Listing 18.27 in the root directory of your application. Listing 18.27 DebugMode/Web.Config<configuration> <system.web> <compilation debug="true" /> </system.web> </configuration> The C# version of this code can be found on the CD-ROM. To start debugging an ASP.NET page, follow these steps:
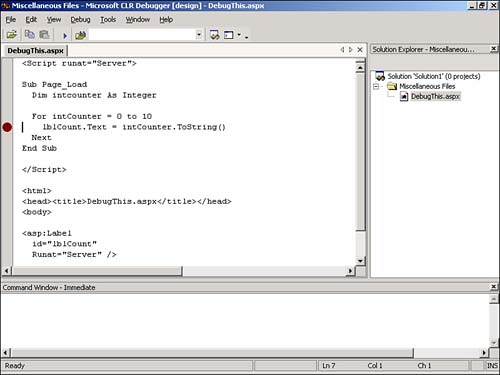
CAUTION Never use the debugger on a production Web site. When you attach the debugger to an ASP.NET application, it freezes requests to the application. Creating BreakpointsBefore you can debug an ASP.NET page, you must first specify one or more breakpoints in page execution. When an executing page reaches a breakpoint, the debugger enters break mode. You can view the values of variables only when the debugger is in break mode. To set a break point within the debugger, click the margin on the left of the statement where you want the breakpoint to occur. Clicking the margin should cause a solid red dot to appear to signify the breakpoint (see Figure 18.12). You can add as many breakpoints to a page as you want. Figure 18.12. Setting a breakpoint. If you hover your mouse pointer over a breakpoint, a ToolTip displays the line number of the ASP.NET application that is associated with the breakpoint. After you create at least one breakpoint, request the page that you are debugging within a Web browser. The debugger should gain window focus when the breakpoint is reached. The debugger automatically enters break mode. Creating WatchesWhen the debugger is in break mode after reaching a breakpoint, you can view the current values of the variables in a page in several ways. The easiest way to view the value of any variable in the debugger is to hover the mouse pointer over the name of the variable. A ToolTip displays the current value of the variable. Alternatively, you can open the Quick Watch dialog box by selecting Debug, Quick Watch. You also can automatically add a variable to the Quick Watch dialog box by right-clicking the name of the variable and selecting Quick Watch. Within the Quick Watch dialog box, you can view the value of any variable by entering its name in the Expression text box and clicking Recalculate. You can also assign a new value to any variable within the Quick Watch dialog box by clicking its current value and entering a new value. Finally, you can add a watch to the debugger. Within the Quick Watch dialog box, click the Add Watch button. Outside Quick Watch, right-click the name of a variable and select Add Watch. Either method adds the variable to the Watch window. You can edit the value of any variable in the Watch window by clicking its current value and entering a new value. After you add a watch for a variable to the Watch window, the Watch window continues to display the current value of the variable as you step through each line in the ASP.NET page. Stepping Through an ASP.NET PageAfter the debugger hits a breakpoint, you can continue execution in several ways. If you want the page to continue executing until the next breakpoint is reached, you can click the Continue button (the VCR play button). You also can continue page execution by selecting any of the following options from the Debug menu:
You can use Step Into, Step Over, and Step Out with different units of execution. You can step by statement, line, or instruction. To select the unit of execution, choose Debug, Step By. |
EAN: 2147483647
Pages: 263