Hack75.Graph Latency and Jitter
Hack 75. Graph Latency and Jitter
Use sip_ping.pl to record latency and jitter data in a nice, pretty graph. It's time to step beyond the basic ping and traceroute, and to graph packet flow using Perl. In "Monitor VoIP Devices" [Hack #72], you saw how to determine the availability of a SIP host using Perl and the SIP OPTIONS packet. The next logical step is to time how long it takes to receive a response to monitor the latency on the link between you and the device you're monitoring. This hack uses the script from "Monitor VoIP Devices" [Hack #72], but this time you use the t option to time the round trip: # ./sip_ping.pl t 192.168.0.123 50.77 This shows me that it took almost 51 milliseconds for my Snom handset to respond to a SIP request. This isn't a terribly useful test, however, considering I'm timing this response from my desktop computer hooked up to phone's built-in switch. Latency (and its cousin, jitter) starts to be an issue when your VoIP traffic passes out of your local area network (LAN) and traverses the wide Internet. For every router that your VoIP traffic passes through, there is a chance for your VoIP packets to be delayed or, worse, dropped. You can use the traceroute (tracert on Windows) application to see how many hops it takes to get from your computer to a remote VoIP provider. Here is an example from my PC to a SIP-based Internet telephony provider: # traceroute sip.example.com traceroute to sip.example.com (172.16.15.15), 30 hops max, 38 byte packets 1 192.168.0.1 (192.168.0.1) 0.213 ms 0.189 ms 0.194 ms 2 10.69.128.1 (10.69.128.1) 12.113 ms 12.343 ms 22.133 ms 4 10.25.25.25 (10.25.25.25) 7.280 ms 7.777 ms 9.138 ms 5 sip.example.com (172.16.15.15) 74.124 ms 77.450 ms 77.033 ms This shows that my VoIP traffic has to pass through five routers every time I make a call. If any router gets congested or starts having problems, my call quality can suffer. Though knowing about troublesome routers along the path is important, to keep things simple, you can focus most of your concern on the time delay between yourself and the destination host. To determine this you can use the ping utility: # ping sip.example.com PING sip.example.com (172.16.15.15) 56(84) bytes of data. 64 bytes from 172.16.15.15: icmp_seq=0 ttl=53 time=74.4 ms 64 bytes from 172.16.15.15: icmp_seq=1 ttl=53 time=74.4 ms 64 bytes from 172.16.15.15: icmp_seq=2 ttl=53 time=79.0 ms 64 bytes from 172.16.15.15: icmp_seq=3 ttl=53 time=75.4 ms 64 bytes from 172.16.15.15: icmp_seq=4 ttl=53 time=77.8 ms This shows that there is a 74 to 78 ms delay between my computer and the remote VoIP server. This delay is called latency. In the context of VoIP traffic, it's not always a bad thing to have consistent latency. Imagine if I consistently have 100 ms of latency on my call. That is, it takes one-tenth of a second for my speech to reach the ears of the person I am talking to. This isn't terribly noticeable. However, if this 100 ms delay suddenly evaporated to 50 ms and then jumped back to 100 ms, this would definitely create audible abnormalities in my speech. Every time it sped up, the audio would skip over the slower packets that hadn't arrived yet. Every time it slowed down, there would be a slight pause, waiting for more audio to arrive. This is called jitter, and this is the true source of quality problems on the VoIP frontier. However, this is not to say that latency is not an important measurement. Latency measurements can be a basis for measuring the potential for jitter. For example, say I have two hosts: one with 200 ms of latency and one with 5 ms of latency. A 20% variation in latency will result in 40 ms of jitter from the first host, and only 1 ms of jitter from the second. One way to deal with jitter is to use a jitter buffer, a device that basically delays playing or sending on the audio packets for a short period of time to cushion against any delayed or out-of-order packets. As the packets arrive, the buffer grows and shrinks to accommodate variations in their latency, thus smoothing out their perceived latency. While jitter buffers are an excellent tool for improving audio quality on VoIP traffic, they still come with the cost of added latency in the call. It is preferable to eliminate the jitter on the network altogether, if possible. One big source of jitter and latency is network congestion. Let's suppose that you're on an important VoIP call, when somebody on your network decides to download the latest movie trailer, instantly using up all of your bandwidth. Suddenly your VoIP packets have to wait in line behind the movie trailer packets, causing a change in latencyi.e., jitter. One solution to this problem is to use QoS policies on your router. This is the practice of prioritizing some types of network traffic ahead of others. QoS works well because some network traffic, like downloading movie trailers or checking your email, is not affected by small changes in latency or jitter, and other services, like VoIP traffic, are. This uncovers a flaw in our use of traceroute and ping to measure latency. Because ping traffic is not the same as VoIP traffic, some routers' QoS policies might treat them differently. Hence the need for our Perl SIP ping utility [Hack #72]. As it uses SIP, it provides a much better estimate for measuring VoIP latency and jitter. In addition to network latency, it will also measure any latency injected into the system by the SIP application listening on the other end. However, since SIP-based VoIP relies heavily upon another protocol altogether to carry the actual audio streamsReal-time Transport Protocol (RTP)measuring latency and jitter merely by sending SIP messages isn't foolproof. Yet, since SIP and RTP are almost always UDP (and ping packets are not), this kind of measurement is better than using ping and traceroute. Plus, many VoIP-aware routers give the same preference to SIP as they do to RTP, so the results you get using this technique might not be too far off. 6.5.1. The HackTiming the round trip of SIP with Perl is only half of this hack. The second half is using a Unix program called RRDtool (http://people.ee.ethz.ch/~oetiker/webtools/rrdtool/) to graph the data. RRDtool is a generic utility for graphing data over time. You'll need to build it by following the instructions at the author's web site. Once you've installed RRDtool on your Linux PC, you'll use it to graph the SIP latency of three different SIP providers. The first thing to do is create the rrd database file, which RRDtool will use to accumulate the data you'll graph later: $rrdtool create voiphacks.rrd -s 300 DS:provider1:GAUGE:300:U:U \ DS:provider2:GAUGE:300:U:U DS:provider3:GAUGE:300:U:U \ RRA:MAX:0.5:1:10000 This says that we will take 10,000 samples of SIP ping time. One ping will happen every 5 minutes until 10,000 pings have occurred. There are three data sources, one for each of three providers that will be guinea pigs with which to build the graph. You will notice that this creates a file called voiphacks.rrd. This is the database file that will be storing the latency measurements. The next step is to make the measurements. The following shell script will launch an instance of RRDtool, taking latency measurements from the three providers using our sip_ping.pl utility once every 5 minutes: #!/bin/sh SIP_PING="../sip_ping.pl -t" while /bin/true; do PROVIDER1=`${SIP_PING} sip.provider1.com 2>/dev/null || echo "INF"` PROVIDER2=`${SIP_PING} sip.provider2.com 2>/dev/null || echo "INF"` PROVIDER3=`${SIP_PING} sip.provider3.com 2>/dev/null || echo "INF"` rrdtool update voiphacks.rrd N:${PROVIDER1}:${PROVIDER2}:${PROVIDER3} done You can run this in the background on a Unix system. Don't forget to make your script executable (chmod 755 filename.sh) and put it in a place where it can be seen by any startup scripts if you decide to have it run on system boot. If you'd like to run the script periodically, you can add it to your /etc/crontab file so that the cron daemon can run it automatically according to your own timetable. After you have accumulated a day's worth of data, you can graph the results: $rrdtool graph pingtimes_daily.gif -v "milliseconds" \ --title="Latency over 1 day" -s now-1d -w 875 -h 475 \ DEF:provider1=voiphacks.rrd:provider1:MAX \ DEF:provider2=voiphacks.rrd:provider2:MAX \ DEF:provider3=voiphacks.rrd:provider3:MAX \ LINE2:provider1#882222:"Provider 1" LINE2:provider2#228822:"Provider 2" \ LINE2:provider3#222288:"Provider 3" This will produce a graph of a full day's results, taken at five-minute intervals (Figure 6-1). If you'd like to graph a longer period of time, you can change the -s option to something like now-1w for a week, or now-1m for the results graphed over a month. The manpage for rrdgraph has some more examples that show how to tweak the output. Figure 6-1. A graph of latency and jitter across a VoIP link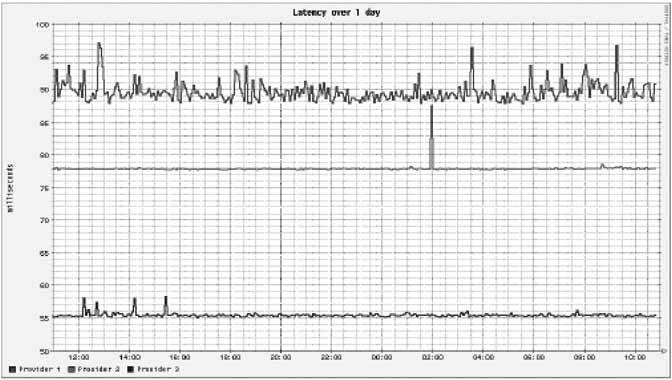 This graphs latency measured over time. To determine jitter, you can examine the variation in the line on the graph for each host. If it's a consistent 80 ms flat line, there's little likelihood of jitter. If it bounces all over the place, it's more likely that you'll experience jitter on a call. Because this script takes a sample only every five minutes, it doesn't provide the truest possible measurement of the type of jitter that will affect a VoIP call. But since it's very difficult to trigger UDP datagrams at a real-world rate of 20 to 50 per second using the sip_ping.pl and RRDtool tools, measuring latency over time will have to suffice. Plus, with that many samples, you'd have a ton of numbers to crunch to figure out the utilization trends over a long span of time, like days, weeks, or years. By compromising short-term accuracy and taking samples only every five minutes, it's easy to look at latency over long spans of time. Brian Degenhardt |
EAN: 2147483647
Pages: 156
- Challenging the Unpredictable: Changeable Order Management Systems
- The Effects of an Enterprise Resource Planning System (ERP) Implementation on Job Characteristics – A Study using the Hackman and Oldham Job Characteristics Model
- Data Mining for Business Process Reengineering
- Relevance and Micro-Relevance for the Professional as Determinants of IT-Diffusion and IT-Use in Healthcare
- Development of Interactive Web Sites to Enhance Police/Community Relations