Showing Cause and Effect
|
With the Cause And Effect template, you can diagram the variables that lead to a particular outcome. Cause and effect diagrams are also called fishbone diagrams, after their skeletal appearance, or Ishikawa diagrams, after their inventor, Dr. Kaoru Ishikawa, a quality control statistician. They represent a different paradigm from a flowchart, in which one step leads to another. A fishbone diagram shows input from numerous sources, as Figure 9-12 shows, which makes it a great tool for the following:
-
To study a problem or issue and determine its root cause.
-
To show that success will require efforts from several departments.
-
To identify areas for data collection.
-
To show why a process isn’t running smoothly or producing the desired results.
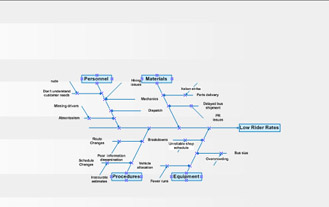
Figure 9-12: You can create a fishbone diagram with the Cause And Effect template.
Creating a Fishbone Diagram
When you open the Cause And Effect Diagram template, Visio creates a page that includes a blank fishbone diagram: an effect shape (the spine) and four category boxes, as Figure 9-13 shows. You can add, remove, or reposition the category boxes, and you can add as many cause shapes as you need.
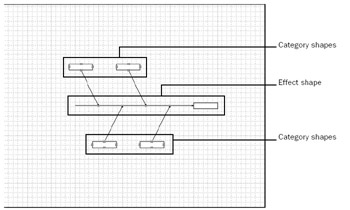
Figure 9-13: Visio sets up the bare bones of a fishbone diagram when you start a diagram with the Cause And Effect template.
Categories of a fishbone diagram
Visio creates a fishbone diagram with space for four categories, because fishbone methodology suggests these categories: materials, machines, methods, and manpower (the four M’s); provisions, people, place, and procedures (the four P’s); or surroundings, suppliers, systems, and skills (the four S’s).
Follow these steps to create a fishbone diagram:
-
Choose File, New, Business Process, Cause And Effect Diagram.
Visio creates a letter-sized page with an effect and four category shapes and opens the Cause And Effect Diagram Shapes, Borders And Titles, and Backgrounds stencils.
-
Select the effect shape in the drawing, and then type its label.
This text should describe the effect, problem, or objective whose causes you’re illustrating.
-
Select a category box, and then type a name for the category of causes it represents.
-
To add a category, drag a Category 1 or Category 2 shape to the effect shape so that the category’s arrowhead touches the effect line (the spine).
-
To delete a category you don’t need, select a category shape, and then press Delete.
-
Drag a Primary Cause 1 or Primary Cause 2 shape from the stencil to a category shape. Place the arrowhead on the category line to glue the shapes.
Tip If your text doesn’t fit, try realigning the paragraph. Visio centers the text by default, but depending on the direction in which the shape points, you can choose Align Left or Align Right from the Formatting toolbar to move text closer to the line.
-
Drag a Secondary Cause shape from the stencil to a primary cause shape in the diagram.
Tip The only difference between the different primary and secondary cause shapes on the stencil is the direction of the line and placement of the text. The shapes are numbered only to differentiate them, not to imply any sequence or hierarchy.
-
To label a primary or secondary cause, select the shape, and then type.
Editing Text
Fishbone diagrams can quickly become crowded or cluttered. Actually, this is a good sign. Because each bone or rib represents a related idea, a diagram with many branches explores that many more possibilities. However, to make the diagram easier to read, be judicious with the label wording. Use text to state problems or issues, not solutions.
If long labels overlap other shapes, try one of the following:
-
Click Align Left or Align Right on the Formatting toolbar to move the text closer to its line.
-
Add line breaks. Select the Text tool, click in the text, and then press Ctrl+Enter.
Effect, category, and cause shapes are all examples of 1-D shapes. For details about working with text on 1-D shapes, see “Adding Text to Lines and Connectors,” page 93.
Moving Cause and Effect Shapes
To move cause and category shapes in your diagram, drag the line by its middle, rather than its endpoints, to move the entire shape without changing the line’s angle. When you drag a shape that has other shapes glued to it, the shape you drag moves, and the connected shapes stretch to remain attached. To move an entire branch, select all the shapes, as Figure 9-14 shows. To lengthen or shorten lines, drag an endpoint.
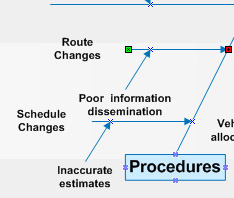
Figure 9-14: To move crowded shapes, select a primary cause shape and all the secondary cause shapes, and then drag. If you drag only the primary cause shape, secondary cause shapes stretch to remain attached.
| Note | Visio 2003 does not include the Import Flowchart Data Wizard. You can, however, open flowcharts created with the wizard in earlier versions of Visio. |
|
EAN: 2147483647
Pages: 209