Common VBA Charting Techniques
In this section, I describe how to use VBA to perform some common tasks that involve charts .
Creating an embedded chart
In Excel 2007, a ChartObject is a special type of Shape object. Therefore, it's a member of the Shapes collection. To create a new chart, use the AddChart method of the Shapes collection. The following statement creates an empty embedded chart:
ActiveSheet.Shapes.AddChart
The AddChart method can use five arguments (all are optional):
-
Type: The type of chart. If omitted, the default chart type is used. Constants for all of the chart types are provided (for example, xlArea , xlColumnClustered , and so on).
-
Left: The left position of the chart, in points. If omitted, Excel centers the chart horizontally.
-
Top: The top position of the chart, in points. If omitted, Excel centers the chart vertically.
-
Width: The width of the chart, in points. If omitted, Excel uses 354.
-
Height: The height of the chart, in points. If omitted, Excel uses 210.
In many cases, you may find it efficient to create an object variable when the chart is created. The following procedure creates a line chart that can be referenced in code by using the MyChart object variable:
Sub CreateChart() Dim MyChart As Chart Set MyChart = ActiveSheet.Shapes.AddChart(xlLineMarkers).Chart End Sub
| |
Using the AddChart method of the Shapes collection (as described in "Creating an embedded chart") is the "new" way of creating charts, introduced in Excel 2007. For compatibility purposes, you can still use the Add method of the ChartObjects collection. This method, unlike the AddChart method of the Shapes objects, does not allow you to specify the chart type as an argument, so you need to use the ChartType property if you want to use anything except the default chart type. In addition, the Left , Top , Width , and Height arguments are required.
The procedure that follows uses the Add method of the ChartObjects collection to create an embedded chart.
Sub CreateChart2() Dim MyChart As Chart Dim DataRange As Range Set DataRange = ActiveSheet.Range("A1:C7") Set MyChart = ActiveSheet.ChartObjects.Add(10, 10, 354, 210).Chart MyChart.SetSourceData Source:=DataRange MyChart.ChartType = xlColumnClustered End Sub | |
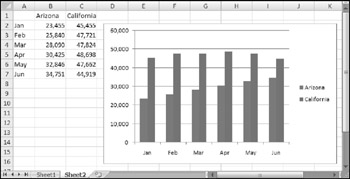
A chart without data is not very useful, so you'll want to use the SetSourceData method to add data to a newly-created chart. The procedure that follows demonstrates the SetSourceData method. This procedure creates the chart shown in Figure 18-2.

Figure 18-2: A few lines of VBA code created this chart.
Sub CreateChart() Dim MyChart As Chart Dim DataRange As Range Set DataRange = ActiveSheet.Range("A1:C7") Set MyChart = ActiveSheet.Shapes.AddChart.Chart MyChart.SetSourceData Source:=DataRange End Sub Creating a chart on a chart sheet
The preceding section describes the basic procedures for creating an embedded chart. To create a chart on a chart sheet, use the Add method of the Charts collection. The Add method of the Charts collection uses several optional arguments, but these arguments specify the position of the chart sheet - not chart- related information.
The example that follows creates a chart on a chart sheet and specifies the data range and chart type:
Sub CreateChartSheet() Dim MyChart As Chart Dim DataRange As Range Set DataRange = ActiveSheet.Range("A1:C7") Set MyChart = Charts.Add MyChart.SetSourceData Source:=DataRange ActiveChart.ChartType = xlColumnClustered End Sub Using VBA to activate a chart
When a user clicks any area of an embedded chart, the chart is activated. Your VBA code can activate an embedded chart with the Activate method. Here's a VBA statement that's the equivalent of Ctrl+clicking an embedded chart:
ActiveSheet.ChartObjects("Chart 1").Activate If the chart is on a chart sheet, use a statement like this:
Sheets("Chart1").Activate Alternatively, you can activate a chart by selecting its containing Shape:
ActiveSheet.Shapes("Chart 1").Select When a chart is activated, you can refer to it in your code by using the ActiveChart property (which returns a Chart object). For example, the following instruction displays the name of the active chart. If there is no active chart, the statement generates an error:
MsgBox ActiveChart.Name
To modify a chart with VBA, it's not necessary to activate it. The two procedures that follow have exactly the same effect. That is, they change the embedded chart named Chart 1 to an area chart. The first procedure activates the chart before performing the manipulations; the second one doesn't:
Sub ModifyChart1() ActiveSheet.ChartObjects("Chart 1").Activate ActiveChart.ChartType = xlArea End Sub Sub ModifyChart2() ActiveSheet.ChartObjects("Chart 1").Chart.ChartType = xlArea End Sub Moving a chart
A chart embedded on a worksheet can be converted to a chart sheet. To do so manually, just activate the embedded chart and choose Chart Tools ![]() Design
Design ![]() Location
Location ![]() Move Chart. In the Move Chart dialog box, select the New Sheet option and specify a name.
Move Chart. In the Move Chart dialog box, select the New Sheet option and specify a name.
You can also convert an embedded chart to a chart sheet by using VBA. Here's an example that converts the first ChartObject on a worksheet named Sheet1 to a chart sheet named MyChart :
Sub MoveChart1() Sheets("Sheet1").ChartObjects(1).Chart. _ Location xlLocationAsNewSheet, "MyChart" End Sub The following example does just the opposite of the preceding procedure: It converts the chart on a chart sheet named MyChart to an embedded chart on the worksheet named Sheet1 .
Sub MoveChart2() Charts("MyChart") _ .Location xlLocationAsObject, "Sheet1" End Sub | |
Every ChartObject object has a name, and every Chart contained in a ChartObject has a name. That certainly seems straightforward enough, but it can be confusing. Create a new chart on Sheet1 and activate it. Then activate the VBA Immediate window and type a few commands:
? ActiveSheet.Shapes(1).Name Chart 1 ? ActiveSheet.ChartObjects(1).Name Chart 1 ? ActiveChart.Name Sheet1 Chart 1 ? Activesheet.ChartObjects(1).Chart.Name Sheet1 Chart 1
If you change the name of the worksheet, the name of the Chart also changes. However, you can't change the name of a Chart that's contained in a ChartObject . If you try to do so using VBA, you get an inexplicable "out of memory" error.
What about changing the name of a ChartObject ? The logical place to do that is in the Name box (to the left of the Formula bar). Although you can rename a shape by using the Name box, you can't rename a chart (even though a chart is actually a shape). To rename an embedded chart, use the Chart Name control in the Chart Tools ![]() Layout
Layout ![]() Properties group . This control displays the name of the active chart (which is actually the name of the ChartObject ), and you can use this control to change the name of the ChartObject . Oddly, Excel allows you to use the name of an existing ChartObject . In other words, you could have a dozen embedded charts on a worksheet, and every one of them can be named Chart 1 .
Properties group . This control displays the name of the active chart (which is actually the name of the ChartObject ), and you can use this control to change the name of the ChartObject . Oddly, Excel allows you to use the name of an existing ChartObject . In other words, you could have a dozen embedded charts on a worksheet, and every one of them can be named Chart 1 .
Bottom line? Be aware of this quirk. If you find that your VBA charting macro isn't working, make sure that you don't have two identically named charts.
| |
| Note | Using the Location method also activates the relocated chart. |
Using VBA to deactivate a chart
You can use the Activate method to activate a chart, but how do you deactivate (that is, unselect ) a chart? According to the Help System, you can use the Deselect method to deactivate a chart:
ActiveChart.Deselect
However, this statement simply doesn't work - at least in the initial release of Excel 2007.
As far as I can tell, the only way to deactivate a chart by using VBA is to select something other than the chart. For an embedded chart, you can use the RangeSelection property of the ActiveWindow object to deactivate the chart and select the range that was selected before the chart was activated:
ActiveWindow.RangeSelection.Select
Determining whether a chart is activated
A common type of macro performs some manipulations on the active chart (the chart selected by a user). For example, a macro might change the chart's type, apply a style, or export the chart to a graphics file.
The question is, how can your VBA code determine whether the user has actually selected a chart? By selecting a chart, I mean either activating a chart sheet or activating an embedded chart by clicking it. Your first inclination might be to check the TypeName property of the Selection , as in this expression:
TypeName(Selection) = "Chart"
In fact, this expression never evaluates to True . When a chart is activated, the actual selection will be an object within the Chart object. For example, the selection might be a Series object, a ChartTitle object, a Legend object, a PlotArea object, and so on.
The solution is to determine whether ActiveChart is Nothing . If so, then a chart is not active. The following code checks to ensure that a chart is active. If not, the user sees a message and the procedure ends:
If ActiveChart Is Nothing Then MsgBox "Select a chart." Exit Sub Else 'other code goes here End If
You may find it convenient to use a VBA function procedure to determine whether a chart is activated. The ChartIsSelected function, which follows, returns True if a chart sheet is active or if an embedded chart is activated, but returns False if a chart is not activated:
Private Function ChartIsSelected() As Boolean ChartIsSelected = Not ActiveChart Is Nothing End Function
Deleting from the ChartObjects or Charts collection
To delete a chart on a worksheet, you must know the name or index of the ChartObject . This statement deletes the ChartObject named Chart 1 on the active worksheet:
ActiveSheet.ChartObjects("Chart 1").Delete To delete all ChartObject objects on a worksheet, use the Delete method of the ChartObjects collection:
ActiveSheet.ChartObjects.Delete
You can also delete embedded charts by accessing the Shapes collection. The following statement deletes Chart 1 on the active worksheet:
ActiveSheet.Shapes("Chart 1").Delete And this statement deletes all embedded charts (and all other shapes):
ActiveSheet.Shapes.Delete
To delete a single chart sheet, you must know the chart sheet's name or index. The following statement deletes the chart sheet named Chart1 :
Charts("Chart1").Delete To delete all chart sheets in the active workbook, use the following statement:
ActiveWorkbook.Charts.Delete
Deleting sheets causes Excel to display a warning like the one shown in Figure 18-3. The user must reply to this prompt in order for the macro to continue. If you are deleting a sheet with a macro, you probably won't want this warning prompt to appear. To eliminate the prompt, use the following series of statements:

Figure 18-3: Attempting to delete one or more chart sheets results in this message.
Application.DisplayAlerts = False ActiveWorkbook.Charts.Delete Application.DisplayAlerts = True
Looping through all charts
In some cases, you may need to perform an operation on all charts. The following example applies changes to every embedded chart on the active worksheet. The procedure uses a loop to cycle through each object in the ChartObjects collection and then accesses the Chart object in each and changes several properties.
Sub FormatAllCharts() Dim ChtObj As ChartObject For Each ChtObj In ActiveSheet.ChartObjects With ChtObj.Chart .ChartType = xlLineMarkers .ApplyLayout 3 .ChartStyle = 12 .ClearToMatchStyle .SetElement msoElementChartTitleAboveChart .SetElement msoElementLegendNone .SetElement msoElementPrimaryValueAxisTitleNone .SetElement msoElementPrimaryCategoryAxisTitleNone .Axes(xlValue).MinimumScale = 0 .Axes(xlValue).MaximumScale = 1000 End With Next ChtObj End Sub
| CD-ROM | This example is available on the companion CD-ROM. The filename is |
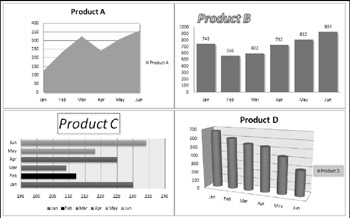
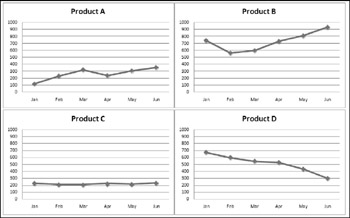
Figure 18-4 shows four charts that use a variety of different formatting; Figure 18-5 shows the same charts after running the FormatAllCharts macro.

Figure 18-4: These charts use different formatting.

Figure 18-5: A simple macro applied consistent formatting to the four charts.
The following macro performs the same operation as the preceding FormatAllCharts procedure but works on all the chart sheets in the active workbook:
Sub FormatAllCharts2() Dim cht as Chart For Each cht In ActiveWorkbook.Charts With cht .ChartType = xlLineMarkers .ApplyLayout 3 .ChartStyle = 12 .ClearToMatchStyle .SetElement msoElementChartTitleAboveChart .SetElement msoElementLegendNone .SetElement msoElementPrimaryValueAxisTitleNone .SetElement msoElementPrimaryCategoryAxisTitleNone .Axes(xlValue).MinimumScale = 0 .Axes(xlValue).MaximumScale = 1000 End With Next cht End Sub
Sizing and aligning ChartObjects
A ChartObject object has standard positional ( Top and Left ) and sizing ( Width and Height ) properties that you can access with your VBA code. Oddly, the Excel 2007 Ribbon has controls (in the Chart Tools ![]() Format
Format ![]() Size group) to set the Height and Width , but not the Top and Left .
Size group) to set the Height and Width , but not the Top and Left .
The following example resizes all ChartObject objects on a sheet so that they match the dimensions of the active chart. It also arranges the ChartObject objects into a userspecified number of columns .
Sub SizeAndAlignCharts() Dim W As Long, H As Long Dim TopPosition As Long, LeftPosition As Long Dim ChtObj As ChartObject Dim i As Long, NumCols As Long If ActiveChart Is Nothing Then MsgBox "Select a chart to be used as the base for the sizing" Exit Sub End If 'Get columns On Error Resume Next NumCols = InputBox("How many columns of charts?") If Err.Number <> 0 Then Exit Sub If NumCols < 1 Then Exit Sub On Error GoTo 0 'Get size of active chart W = ActiveChart.Parent.Width H = ActiveChart.Parent.Height 'Change starting positions, if necessary TopPosition = 100 LeftPosition = 20 For i = 1 To ActiveSheet.ChartObjects.Count With ActiveSheet.ChartObjects(i) .Width = W .Height = H .Left = LeftPosition + ((i - 1) Mod NumCols) * W .Top = TopPosition + Int((i - 1) / NumCols) * H End With Next i End Sub If no chart is active, the user is prompted to activate a chart that will be used as the basis for sizing the other charts. I use an InputBox function to get the number of columns. The values for the Left and Top properties are calculated within the loop.
| CD-ROM | This workbook, named |
Exporting a chart
In some cases, you may need an Excel chart in the form of a graphics file. For example, you may want to post the chart on a Web site. One option is to use a screen capture program and copy the pixels directly from the screen. Another choice is to write a simple VBA macro.
The procedure that follows uses the Export method of the Chart object to save the active chart as a GIF file.
Sub SaveChartAsGIF () Dim Fname as String If ActiveChart Is Nothing Then Exit Sub Fname = ThisWorkbook.Path & "\" & ActiveChart.Name & ".gif" ActiveChart.Export FileName:=Fname, FilterName:="GIF" End Sub
Other choices for the FilterName argument are "JPEG" and "PNG" . Usually, GIF and PNG files look better. Keep in mind that the Export method will fail if the user doesn't have the specified graphics export filter installed. These filters are installed in the Office (or Excel) setup program.
Exporting all graphics
One way to export all graphic images from a workbook is to save the file in HTML format. Doing so creates a directory that contains GIF and PNG images of the charts, shapes, clipart, and even copied range images (created with Home ![]() Clipboard
Clipboard ![]() Paste
Paste ![]() As Picture
As Picture ![]() Paste As Picture).
Paste As Picture).
Here's a VBA procedure that automates the process. It works with the active workbook:
Sub SaveAllGraphics() Dim FileName As String Dim TempName As String Dim DirName As String Dim gFile As String FileName = ActiveWorkbook.FullName TempName = ActiveWorkbook.Path & "\" & _ ActiveWorkbook.Name & "graphics.htm" DirName = Left(TempName, Len(TempName) - 4) & "_files" ' Save active workbookbook as HTML, then reopen original ActiveWorkbook.Save ActiveWorkbook.SaveAs FileName:=TempName, FileFormat:=xlHtml Application.DisplayAlerts = False ActiveWorkbook.Close Workbooks.Open FileName ' Delete the HTML file Kill TempName ' Delete all but *.PNG files in the HTML folder gFile = Dir(DirName & "\*.*") Do While gFile <> "" If Right(gFile, 3) <> "png" Then Kill DirName & "\" & gFile gFile = Dir Loop ' Show the exported graphics Shell "explorer.exe " & DirName, vbNormalFocus End Sub
The procedure starts by saving the active workbook. Then it saves the workbook as an HTML file, closes the file, and re-opens the original workbook. Next, it deletes the HTML file because we're just interested in the folder that it creates (that's where the images are). The code then loops through the folder and deletes everything except the PNG files. Finally, it uses the Shell function to display the folder.
| CD-ROM | This example is available on the companion CD-ROM. The filename is |
EAN: 2147483647
Pages: 319