Creating a Reverse Pivot Table
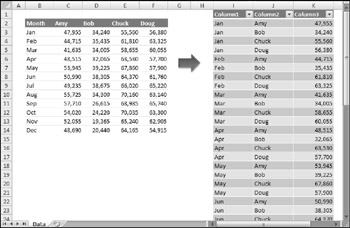
A pivot table is a summary of data in a table. But what if you have a summary table, and you'd like to create a table from it? Figure 17-8 shows an example. Range B2:F14 contains a summary table - similar to a very simple pivot table. Columns I:K contain a 48-row table created from the summary table. In the table, each row contains one data point, and the first two columns describe that data point.

Figure 17-8: The summary table on the left will be converted to the table on the right.
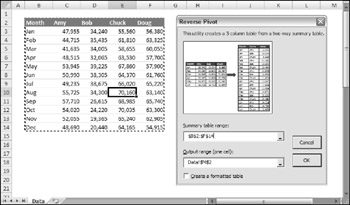
Excel doesn't provide a way to transform a summary table into a table, so it's a good job for a VBA macro. After I created this macro, I spent a bit more time and added a UserForm, shown in Figure 17-9. The UserForm gets the input and output ranges and also has an option to convert the output range to a table.

Figure 17-9: This dialog box asks the user for the ranges.
| CD-ROM | This workbook, named |
When the user clicks the OK button in the UserForm, VBA code validates the ranges and then calls the ReversePivot procedure with this statement:
Call ReversePivot(SummaryTable, OutputRange, cbCreateTable)
It passes three arguments:
-
SummaryTable : A Range object that represents the summary table.
-
OutputRange : A Range object that represents the upper-left cell of the output range.
-
cbCreateTable : The Checkbox object on the UserForm.
This procedure will work for any size summary table. The number of data rows in the output table will be equal to the (r-1) * (c-1) , where r and c represent the number of rows and columns in the Summary Table.
The code for the ReversePivot procedure follows :
Sub ReversePivot(SummaryTable As Range, _ OutputRange As Range, CreateTable As Boolean) Dim r As Long, c As Long Dim OutRow As Long, OutCol As Long ' Convert the range OutRow = 2 Application.ScreenUpdating = False OutputRange.Range("A1:C3") = Array("Column1", "Column2", "Column3") For r = 2 To SummaryTable.Rows.Count For c = 2 To SummaryTable.Columns.Count OutputRange.Cells(OutRow, 1) = SummaryTable.Cells(r, 1) OutputRange.Cells(OutRow, 2) = SummaryTable.Cells(1, c) OutputRange.Cells(OutRow, 3) = SummaryTable.Cells(r, c) OutRow = OutRow + 1 Next c Next r ' Make it a table? If CreateTable Then _ ActiveSheet.ListObjects.Add xlSrcRange, _ OutputRange.CurrentRegion, , xlYes End Sub The procedure is fairly simple. The code loops through the rows and columns in the input range and then writes the data to the output range. The output range will always have three columns. The OutRow variable keeps track of the current row in the output range. Finally, if the user checked the check box, the output range is converted to a table by using the Add method of the ListObjects collection.
EAN: 2147483647
Pages: 319