Adding a PivotChart to a Report
You can now design a form in PivotChart view to graphically display monthly revenue data. Note that a report doesn’t have a PivotChart or Pivot Table view, but it is perfectly legal to embed a form into a report as a subreport. (But you cannot embed a report in a form as a subform.)
Designing the PivotChart Form
When you built the subreport for the Facility Revenue report, you used a simple query on the tblReservations table. For the chart, you need to include the name of the facilitythe ID won’t make much sense in the legend for the chart. In the sample database, you can find a query named qryXmplChtFacilityRevenue that includes both the tblFacilities and tblReservations tables. The fields in the query are FacilityID and FacilityName from the tblFacilities table and CheckOutDate and TotalCharge from the tblReservations table.
To build the chart you need, select the query in the Navigation Pane, and then click the PivotChart button in the Forms group on the Create tab. This command opens a new form object in PivotChart view.
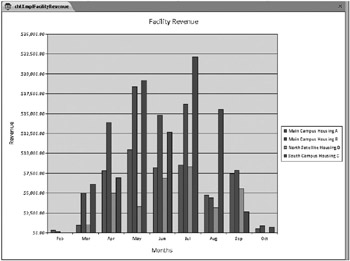
Open the chart field list, and drag and drop the FacilityName field onto the Drop Series Fields Here area of the chart. Click the plus sign next to the CheckOutDate By Month field to expand its list and drag and drop Months onto the Drop Category Fields Here area. Drag and drop the Total Charge field onto the Drop Data Fields Here area-the chart calculates a sum of this field for you. Click the Property Sheet button in the Tools group on the Design tab, and select Chart Workspace on the General tab in the Property Sheet window. Click both the Add Title and Add Legend buttons to add these elements to your chart.
Click the Chart Workspace Title element to select it. In the Property Sheet window, select the Format tab, and enter Facility Revenue in the Caption box. In the PivotChart, click the vertical Axis Title and in the Property Sheet window, enter Revenue in the Caption box. In the PivotChart, click the horizontal Axis Title, and change its Caption to Months. Go back to the General tab, and select the Chart Workspace. On the Show/Hide tab of the Property Sheet window, clear all the options under Show By Default and Let Users View so that users cannot modify the chart. Your chart should now look like Figure 16–38. Switch back to Design view, and set the Default View property to PivotChart. Be sure to save the form, and give it a name such as chtFacilitiesRevenue. You can find this form saved as chtXmplFacilityRevenue in the sample database.

Figure 16–38: This PivotChart form displays facility revenue by month.
Embedding a PivotChart in a Report
The rest is easy. Go to the Navigation Pane, and select the report you created in the previous section to display facilities with revenue by month in a subreport. Open that report in Design view. (You can also open the sample rptXmplFacilityRevenue report.) Select the subreport control, and click the Size To Fit button in the Size group on the Arrange tab to make sure the subreport is exactly one line high to give yourself some room to work. Don’t worry about displaying all the lines in the subreport-when you dragged and dropped it onto the report, Access set its Can Grow property to Yes. When you view the report, Access will expand the subreport control to display all the lines.
Expand the Detail section to about 5.5 inches high. Make sure the Use Control Wizards button in the Controls group is turned off, then click the Subform/Subreport button in the Controls group on the Design tab, and finally draw the control in the Detail section under the previous subreport approximately 5.5 inches wide and 4. inches high. The size of the subreport control affects the resolution of the chart you’re going to put inside it, so you want it big enough to be easily readable. Delete the label from the control. Move the subreport control up under the previous subreport control.
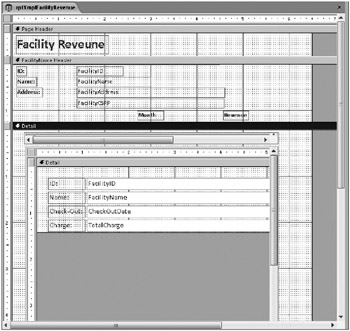
With the new subreport control selected, open the Property Sheet window, and set the Source Object property to the PivotChart form you created earlier. (Or, you can use the example chtXmplFacilityRevenue form in the sample database.) Set both the Link Child Fields and Link Master Fields properties to FacilityID. Your report design should now look like Figure 16–39. Notice that the subreport window shows you the Form view design of the form, not the chart.

Figure 16–39: Your report now includes an embedded PivotChart form as a subreport.
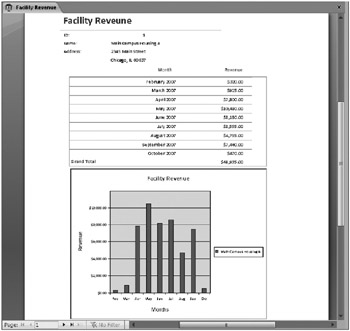
Switch to Print Preview to see the result, as shown in Figure 16–40. Now that layout should make the facilities manager happy! You can find the report saved as rptXmplFacilityRevenueChart in the sample database.

Figure 16–40: Here is your completed report with an embedded subreport and PivotChart in Print Preview.
At this point, you should thoroughly understand the mechanics of constructing reports and working with complex formulas. The next part of the book explores how to apply all you’ve learned to this point to building an Access project that uses Microsoft SQL Server to store your tables and queries (views, stored procedures, and functions).
EAN: 2147483647
Pages: 234