Working with PivotChart Forms
Even when the main purpose of your application is to enter, store, and organize data to support an active business function, you probably want to add features that allow management to analyze the business processes. PivotTables and PivotCharts are ideal for this purpose. In Chapter 8, you learned how to create the PivotTable and PivotChart views of a query. Designing the PivotTable or PivotChart view of a form is exactly the same with some interesting twists:
-
You can use any query or table as the record source of the form, but only fields bound to controls on the form are available to design the PivotTable or PivotChart.
-
You can set form properties to control what users can modify in the PivotTable or PivotChart view, including locking the form so they can’t modify what you designed at all.
-
Because a form has event properties, you can control what the user can modify by writing a Visual Basic procedure to respond to the event.
-
You can embed a form designed in PivotTable or PivotChart view as the subform of another form and set the Link Child Fields and Link Master Fields properties to filter the table or chart to display information relevant to the record on the outer form.
Building a PivotChart Form
In the Housing Reservations application, you might want to track room revenue by month or quarter. In the Conrad Systems Contacts application, charting product sales or the number of contact events by week or month might be critical for judging how effectively the business is running.
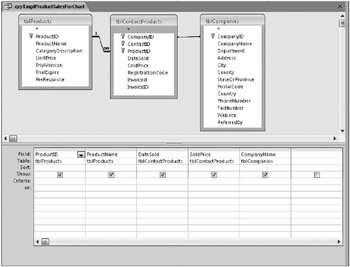
In most cases, you should start by designing a query that fetches the fields you want to display in your PivotTable or PivotChart. In the Conrad Systems Contacts application, you might want to display product sales data by product or by company. The ContactsDataCopy.accdb sample file has a query that gathers this information, qryXmplProductSalesForChart, as shown in Figure 13–41.

Figure 13–41: This sample query selects product sales data by product or by company.
Open the ContactsDataCopy.accdb sample database, select the qryXmplProductSalesForChart query in the Navigation Pane, and click the PivotChart button in the Forms group on the Create tab. Now you can begin to design a chart to show sales by product by month in PivotChart view. From the chart’s field list (click the Field List button in the Show/Hide group on the Design tab if you don’t see this window), drag and drop ProductName onto the Drop Series Fields Here area. Drag and drop SoldPrice onto the Drop Data Fields Here area-the chart automatically calculates a sum for you. Open the Date Sold By Month list, drag and drop Months onto the Drop Category Fields Here area, and then close the field list.
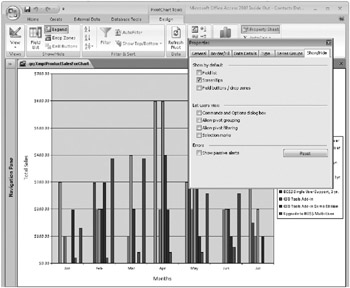
Click the Axis title on the left, and then click the Property Sheet button in the Tools group. Click the Format tab, and enter Total Sales in the Caption property box. Click the General tab, and select Category Axis 1, Title in the Select list. Click the Format tab again, and change the Caption property to Months. Return to the General tab, and select Chart Workspace in the Select list. Click the Add Legend button in the Add area to create a legend on the right side of the chart. Click the Show/Hide tab, clear all the check boxes in the Let Users View section, and clear the Field Buttons/Drop Zones and Field List check boxes to remove them from the chart. Your chart should now look like Figure 13–42.

Figure 13–42: The chart you’re building displays product sales by product and month.
Switch to Design view, and set Allow Edits, Allow Deletions, and Allow Additions all to No. Finally, change the Shortcut Menu property to No to keep the user from getting into the chart property settings that way. (You can see how much more control you have over what the user can do in a form.) Save the form as chtProductSalesByProduct. You can also find this form saved as chtXmplProductSales in the sample database.
Embedding a Linked PivotChart
To demonstrate how you can link the chart you just built into a form that displays product information, you can start with frmXmplProducts3 from Chapter 11, “Building a Form.” Open that form in Design view. Widen the design area to about 7.5 inches, and expand the Detail section’s height to about 4.25 inches to give you a space to place the chart. Drag and drop the form you just created from the Navigation Pane onto the blank area of the form, and select and delete the attached label.
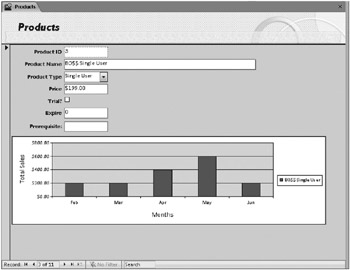
Notice that Access automatically sizes the subform control to the design height and width of the form, which is probably not big enough to show the chart very well. Access doesn’t look at the chart design to determine what height and width might work well to display the PivotChart view of the subform. (Does this remind you of the sizing problems you have with a subform in Datasheet view?) Stretch the width and height of the subform control to fill up the blank space you created. Open the Property Sheet window, and with the subform control selected, set the Locked property to Yes. Verify that the Link Child Fields and Link Master Fields properties are set to ProductID. (Because the outer form is based on a table, dragging and dropping the subform should have set these properties automatically.) Switch to Form view to see the result of your work as shown in Figure 13–43. You can also find this form saved as frmXmplProductsWithSales in the sample database.

Figure 13–43: This form displays product information with a sales chart in a subform.
| Note | You might be wondering why the scale on the left in Figure 13–43 doesn’t seem to match what you designed in Figure 13–42. The PivotChart view adjusts its horizontal and vertical scales to match the size of the display window. If you had designed the subform control taller, you might have seen the scale match. |
This is the last chapter about designing forms for desktop applications. You’ll learn about how form design is different for Access projects in Chapter 28, “Designing Forms in an Access Project,” and you’ll learn some additional design techniques that you can automate with Visual Basic code in Chapter 20.
EAN: 2147483647
Pages: 234