Debugging Script Task
Once you have identified that a Script task is causing an issue, you need to look into the code defined in it. The concept of debugging script code is similar to what you learned in the "Debugging Control Flow" section: you set breakpoints to suspend execution and look at the state of script through debug windows. The difference is that you can set breakpoints at each line of code and walk through the code line by line using VSA. VSA also provides extra tools to inspect the state of script. The rest of this section will show you how to debug a Script task by using these tools.
Walk Through Code by Using Breakpoints
To debug code defined in your Script task, you need to set at least one breakpoint in the code by using the VSA Code Editor. To create the breakpoint, place the cursor on the line in which you want to create a breakpoint and press F9. When the package is executed and execution reaches the breakpoint in the Script task, VSA appears and highlights the statement in the Code Editor, as shown here:
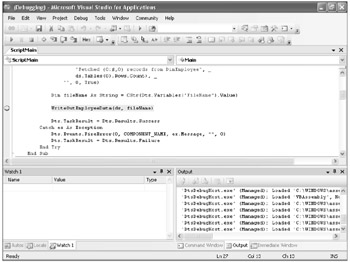
At this point, the highlighted statement is not executed yet. While the execution is suspended, you can inspect elements in the state of the script, such as variables and properties, using debug windows (discussed later in this section). Once you complete the inspection, you can advance to the next statement. VSA provides you with the following options to manage code execution:
-
Continue (assigned to F5) The Continue command executes the rest of the code, including the current statement, and breaks execution at the next breakpoint.
-
Step Into (assigned to F11) The Step Into command executes the current statement and breaks execution at the next statement. If the current statement calls a user-defined method, the Step Into command enters the method and breaks execution at the first line of the method.
-
Step Over (assigned to F10) The Step Over command executes the current statement and breaks execution at the next statement. If the current statement calls a user-defined method, the Step Over command executes the entire method and breaks execution at the next statement in the current method.
-
Step Out (assigned to Shift + F11) The Step Out command executes the rest of the statement in the current method, including the current statement, and then breaks execution at the statement where the current method has been invoked. This command is often used with the Step Into command.
-
Run To Cursor The Run To Cursor command executes the current statement as well as the rest of the statement in the current method defined before the specified line.
Set Breakpoints and Walk through Code
-
If you haven't opened
 Chapter07.sln yet, start BIDS and open the solution file saved in C:\Documents and Settings\<username>\Microsoft Press\is2005SbS\Chap07\Chapter07.sln.
 -
In Solution Explorer, double-click
 DebuggingScriptTask.dtsx.
 -
Double-click Script Task - Export Employees.
-
In the Script Task Editor, select the Script page and click the Design Script… button. VSA appears on the screen.
-
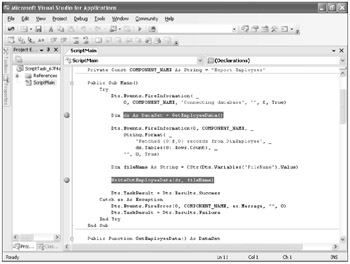
In the Code Editor, place the cursor on the Dim ds As DataSet = GetEmployeeData() line, and then press F9.
The line is highlighted in red, and a red dot appears in the right-side gray band. This indicates that you have set a breakpoint in the statement.
-
Place the cursor on the WriteOutEmployeeData(ds, fileName) line and press F9. Your screen looks like this:
-
Close the VSA code editor window, and then click OK to close the Script Task Editor dialog box.
Notice that a red dot appears on Script Task - Export Employees. This also indicates that you have set breakpoints inside the task.
-
Press F5 to execute the package.
VSA appears and highlights the first line of code that has a breakpoint. Your screen should look like this:
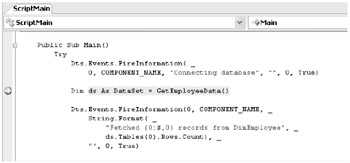
The current statement is not executed yet. You will execute the entire GetEmployeeData method with the Step Over command because you're not interested in each statement in the method.
-
Press F10.
F10 is a shortcut key assigned to the Step Over command. Notice that execution didn't go through the GetEmployeeData method and breaks at the next statement in the Main method.
-
Press F5.
When you press F5, the execution resumes and executes the rest of the statement until it encounters the next breakpoint. Now, execution should break at the Write-OutEmployeeData method line. You will review the method to see its details.
-
Press F11.
Execution enters the WriteOutEmployeeData subroutine and breaks at the first line of the method. Press F11 several times to walk through the statement.
-
Right-click the writer.WriteLine(RECORD_SEPARATOR) line and select Run To Cursor.
Execution resumes and executes the rest of the statement, then breaks at the specified line. This command is often useful if the method needs to go through long statements before it comes to the statement you are interested in.
-
Press Shift + F11.
Shift + F11 is a shortcut key assigned to the Step Out command. Now execution exits the WriteOutEmployeeData method and breaks at the statement that invoked it.
-
Press F5 to exit the Script task.
-
On the Debug menu, select Stop Debugging.
Note Leave the breakpoints in the Script task for the next procedure.
Reviewing State by Using VSA Features
While you are walking through code inside the Script task, you can review the current state by using debug windows, as you learned in the "Debugging Control Flow" section. In addition to the windows discussed in that section, VSA provides others to help debug a Script task.
-
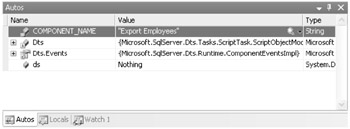
Autos The Autos window has functionality similar to the Locals window. It helps you look into variables or properties that are referred to by the current statement in the Code Editor. The difference between the Locals window and the Autos window is that the Autos window automatically picks up relevant objects according to the current statement.
-
Watch Whereas the Autos window varies its content during execution, the Watch window allows you to track specific items persistently throughout the execution. The Watch window also allows you to specify expressions such as Dts.Variables.Count > 0. To add an item in the Watch window, either right-click an object and select Add Watch or type expressions in the window directly.
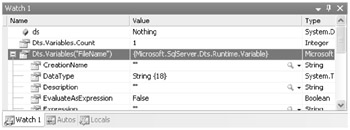
-
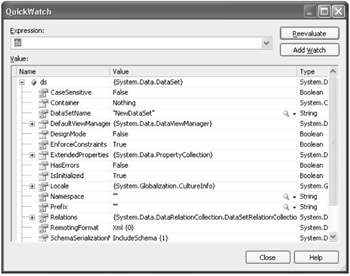
QuickWatch QuickWatch is a dialog box used to examine an object without adding it to the Watch window. QuickWatch allows you to specify expressions such as Watch window. To launch the QuickWatch dialog box, right-click an object and select QuickWatch.
-
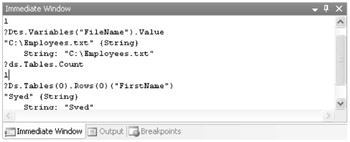
Immediate The Immediate window is a command-line tool window to examine objects or expressions. To examine an object, type expressions after the ? command, such as ? Dts.Variables(<;$QD>ABC<;$QD>).Value. The result appears as text after the command line. IntelliSense helps you type expressions in the Immediate window.
-
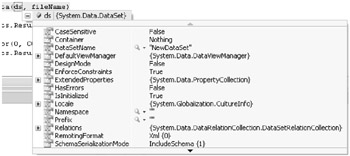
DataTip DataTip allows you to inspect objects without adding them to the Watch window, just like the QuickWatch dialog box. DataTip is an easier tool to use. If you hover the mouse pointer over the variables in the code, DataTip shows the content in a small tips window by the line. If the target is an object (an instance of class), you can inspect its member values by expanding the plus sign that appears in the small window.
-
Output The Microsoft .NET Framework enables you to provide information to the Output window through the System.Diagnostics.Debug class or System.Diagnostics.Trace class, for example, if you have the following code in your Script task:
Debug.WriteLine("Varibles Count:" & Dts.Variables.Count)The following text appears in the Output window when it's executed:
Variables Count: 1
This is often useful when you would like to leave the result in text and compare the intermediate results side by side.
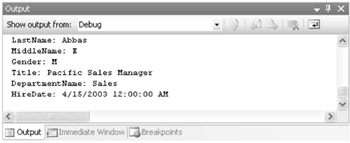
In the following procedure, you will set breakpoints in the code and see the steps through the debugging by using VSA. You will also learn how to use the debug windows for scripts.
Review State, Using Debug Windows
-
Double-click Script Task - Export Employees.
-
In the Script Task Editor, select Script Page and click Design Script. VSA appears on the screen.
-
In the Code Editor, find the Next col statement in the WriteOutEmployeeData subroutine. Insert the following code before the Next col line:
Debug.WriteLine(String.Format("{0}: {1}", _ .Columns(col).ColumnName, .Rows(row)(col))) -
Close VSA and click OK to close the Script Task Editor dialog box.
-
Press F5 to execute the package. Execution breaks at the first breakpoint.
-
On the Debug menu, point to Windows, and then select Autos.
Verify that the Autos window shows objects related to the current statement. Make sure that the ds variable is currently Nothing. Press F10 to execute the GetEmployeeData subroutine, and then notice that the ds variable has been initialized by the GetEmployeeData subroutine. Also, the Autos window now shows the other objects related to the next statement. When you look at the ds.Tables(0).Rows.Count entity, you can see the number of records that have been retrieved from the database.
-
Hover the mouse cursor over the ds variable in the following line:
WriteOutEmployeeData(ds, fileName)
The DataTip window appears by the line and shows the ds variable in the window. If you click the plus sign in the window, you can see all the properties of the ds variable.
-
On the Debug menu, point to Windows, and then select Immediate.
-
In the Immediate window, type the following command, and then press Enter:
?Dts.Variables("FileName").ValueThe content of the FileName variable appears in the next line.
-
Press F5.
-
Find the line you have inserted in the previous step (starts with Debug.WriteLine). Right-click the line and select Run To Cursor.
-
On the Debug menu, point to Windows, point to Watch, and then select Watch 1.
-
In the Watch 1 window, type col in the Name field of the blank line. The value should be 0.
-
Press F10 several times to run through a loop a couple of times. Observe that the col variable is incremented each time the execution passes the For statement.
-
On the View menu, select Output. In the Output window, observe that the field name and value are logged by the Debug.WriteLine method.
-
Press F5 to execute the rest of the statement.
-
On the Debug menu, select Stop Debugging.
Unfortunately, breakpoints are not supported in the Script component. However, it is still possible to write the state out of the component to understand what is happening inside the Script component. First, create a new Output in the Script component to write intermediate data or invalid data out of the component. Connect the Output to an arbitrary destination component, such as Flat File. You can set a data viewer between these two components to review the data while you're executing the package. Another option is to use the Me.Log method to write out to Microsoft Windows Event Log, to SQL Server, or to a text file. You can also use event methods (for instance, FireInformation) defined under Me.ComponentMetadata to write a message to the Progress tab. Refer to Chapter 6, "Scripting Tasks," for details.
EAN: 2147483647
Pages: 152