330.
| [Cover] [Contents] [Index] |
Page 96
array of dimension n×n, where n is the number of classes. The matrix shows the relationship between two samples of measurements taken from the area that has been classified. The first set represents test data that have been collected via field observation, inspection of agricultural records, air photo interpretation, or other similar means. The second sample is composed of the labels of the pixels, allocated by the classifier, that correspond to the test data points. The columns in a confusion matrix represent test data, while rows represent the labels assigned by the classifier. An example, shown in Figure 2.13, involves four information classes, namely, grass, wheat, deciduous woodland and coniferous forest. The numbers of sample pixels for each class in the test data set (column sums) are 76, 80, 102 and 79, respectively, giving a total of 337 test pixels. The row sums show that 55 pixels are classified as grass, 118 as wheat, 89 as deciduous forest, and 75 as coniferous forest. The main diagonal entries of the confusion matrix represent the number of pixels that are given the same identification by the test data and the classifier, and these are the number of pixels that are considered to be correctly classified. In the example, the numbers of correctly classified pixels are 48, 70, 65, and 59, for the four classes, respectively.
Several indices of classification accuracy can be derived from the confusion matrix. The ‘overall accuracy’ is obtained by dividing the sum of main diagonal entries of the confusion matrix by the total number of samples. In the example, the overall classification accuracy is calculated as:
 |
(2.26) |
This result may be interpreted to mean that 71.8% of the image area is correctly classified. Alternatively, the interpretation may be that the probability that a pixel is classified correctly is 71.8%. This overall view treats the classes as a whole and does not provide specific information about the accuracy of each individual class, nor does it relate to the spatial pattern of errors. Moreover, the overall result can be misleading. For instance, if
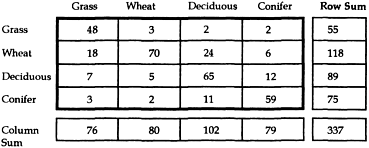
Figure 2.13 A confusion matrix composed of four information classes.
| [Cover] [Contents] [Index] |
EAN: 2147483647
Pages: 354