312.
| [Cover] [Contents] [Index] |
Page 8
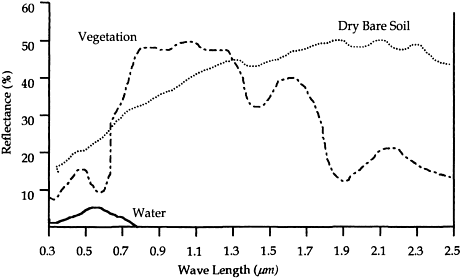
Figure 1.5 Typical spectral reflectance (%) of three materials: green vegetation, bare soil and water.
separated in terms of their reflectance spectra. It is apparent that vegetation reflectance varies considerably across these wavebands. The lowest reflectance values occur at 0.4 μm (i.e. in the blue waveband), while the highest reflectance values occur around the near-infrared and part of the mid-infrared bands. The reflectance spectrum of bare soil, in contrast, shows reflectance increasing smoothly with wavelength. Its reflectance in the visible waveband is greater than that of vegetation, while in near-infrared and part of mid-infrared bands bare soil reflectance becomes less than that of vegetation, and eventually it dominates again beyond wavelengths of around 1.4 μm. The high near-infrared reflectance of vegetation, combined with its low reflectance in the red waveband, is used in the construction of vegetation indices. One such index, the NDVI (normalised difference vegetation index), is described below.
Recent interest in global environmental change has led to the development of global climate models, which require inputs describing land cover type. The AVHRR sensor carried by the NOAA satellite series provides data that are useful for large-scale studies of terrestrial vegetation (Justice et al., 1985; Eidenshink and Faundeen, 1994). A variety of mathematical combinations (e.g. subtraction, ratioing) of AVHRR band 1 (red) and band 2 (near infrared) have been developed to characterise the spatial distribution of vegetation and its condition. The best known of these vegetation indices is the NDVI, defined as:
| [Cover] [Contents] [Index] |
EAN: 2147483647
Pages: 354