17.
| [Cover] [Contents] [Index] |
Page 112
in Figures 3.3d and e are based on the ‘winner takes all’ rule (i.e. a pixel is placed in class i if output neurone i has the largest activity of all neurones in the output layer). The decision boundaries formed by the larger network are more satisfactory than those produced by the smaller network. Does this indicate that larger networks always achieve better classification performance? Before answering this question, we consider a second example.
The second example is a two-class classification problem (Figure 3.4a) in which a two-dimensional domain within the range of [0, 1] has again been partitioned into 100×100 subsquares. Figure 3.4b illustrates the spatial position of the training patterns. The symbol ‘ ’ denotes class 1, and ‘
 ’ indicates class 2. In Figure 3.4c, one more training sample that should belong to class 1 is added (shown by the symbol ‘’ inside a dashed circle), but is treated as if it were a member of class 2. This spurious sample is intended to test network performance in the presence of training noise. The twenty-two samples shown in Figure 3.4c are used to train two networks. The first has a 2|60|10|2 structure with 740 weights, while the second is a
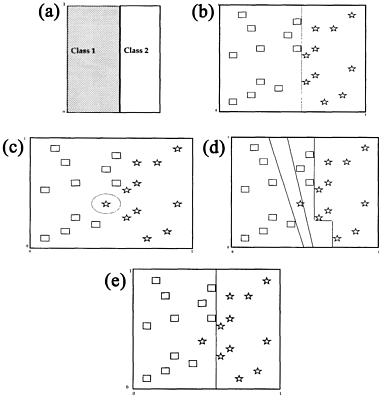
Figure 3.4 (a) A two-class classification problem, (b) Position of training patterns in a two-class case: denotes class I and denotes class 2. (c) One training pattern is added, (d) Resulting decision boundaries realised by a 2|60|10|2 network, (e) Decision boundary formed by a 2|3|2|2 network.
| [Cover] [Contents] [Index] |
EAN: 2147483647
Pages: 354