Invoke Nodes
|
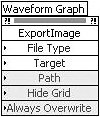
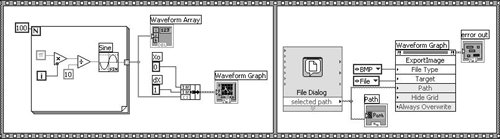
Invoke nodes are very similar to property nodes. Calling an invoke node runs a single method on the front panel object and sometimes requires inputs, (also known as "arguments"). In a way, calling an invoke node is similar to calling a subVI or calling a function or method in other languages. The difference between a property node and an invoke node is that calling an invoke node, "executes something"it doesn't just change the value of a property. You can think of invoke nodes as functions that you execute; whereas a property node is a property, or state, that can be read from or written to. To create an invoke node, pop up on either the front panel object or its terminal, and select one of the control's methods from the Create>>Invoke node>> short-cut menu. A terminal with the same name as the variable will appear on the diagram. The method name will appear as the first item in the invoke node, and all the arguments will appear as items beneath the method name. You can change the method being called by the invoke node with the Operating tool or pop up on the node and choose Methods>>. Now you have the choice of which method you wish to select. Each object has a set of base methods, and usually, an additional set of methods specific to that object. One base method that is available for all controls is Reinitialize to Default (see Figure 13.40). It doesn't have any arguments, and calling it will do just what it saysreinitialize the control to its default value. Figure 13.40. Configuring a control's invoke node to call the Reinitialize to Default method Activity 13-5: Using Invoke Nodes to Export an Image from a GraphIn this activity, you'll see how to use an invoke node specific to graphs, which allows you to export the graph to an image file. We'll use the VI you created in Chapter 8, Graph Sine Array.vi, so you should open that (or use the one on CD-ROM, in the EVERYONE\CH08 folder).
When you run it, you should be able to choose a filename to save the bitmap under. Open the bitmap file this VI creates and you'll see an image created from the waveform graph. |

EAN: 2147483647
Pages: 294