Monitoring Troubleshooting an OSPF Network
Asking questions is a good method of gathering facts, but it is not the only resource available to you. Consider collecting information from other sources such as:
There are a variety of different sources upon which you can draw to assist you in gathering the facts. A good rule of thumb is that the only dumb question is the one never asked. So ask people, look at what the network is telling you, and use the money spent on various networking-related tools. Step 3: Consider Possible Problems The basis for considering a possible problem is tied to the facts you gathered. By using the facts you gathered, you could eliminate potential problems from your list. Armed with your findings and the facts surrounding the problem, you should then use them to discard potential causes of the problem. For example, depending on the data, you might be able to eliminate hardware as a problem, allowing you to focus on software problems. At every opportunity, try to narrow the number of potential problems so that you can create an efficient plan of action. Narrowing down the number of possibilities is key to this step. Analyze the data gathered and use it reduce the potential causes. This will greatly reduce the downtime of the network and increase your accuracy when engaging Step 4. Step 4: Create an Action Plan Create an action plan based on the remaining potential causes. Begin with the most likely cause and devise a plan to either prove or disprove that the cause selected was, in fact, the culprit. When creating an action remember to proceed in steps in which only one variable will be manipulated at a time. For example, I do not see routes to the Internet in my OSPF routing table. I know they are external routes, so I look at my ASBR. I will verify that my ISP is providing me with the correct routes. If they are, then that removes the possibility of an external configuration error as the cause. I can then move onto the next likely cause of my problem. This approach allows you to reproduce a given solution to a specific problem. If you alter more than one variable simultaneously, you might solve the problem, but identifying the specific change that eliminated the symptom becomes more difficult. Step 5: Implement the Action Plan Implement the action plan, performing each step carefully while testing to see if the symptom disappears. I would also recommend that you have a means of recording your steps during this process. This serves multiple purposes during your troubleshooting.
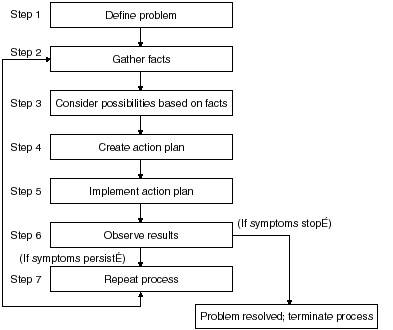
Step 6: Gather Results Whenever you change a variable, be sure to gather the results because these are the facts of what is now occurring. Generally, you should use the same method of gathering facts that you used in Step 2. Analyze the results to determine whether the problem has been resolved. If it has, then the process is complete. If the problem has not been resolved, then continue on to Step 7. Step 7: Reiterate the Process If the problem has not been resolved by this step, you must create another action plan based on the next most likely problem in your list. Return to Step 4 and reiterate the process until the problem is solved. Make sure to undo any “fixes” you made in implementing your first action plan. Remember that you want to change only one variable at a time. Figure 8-3 illustrates the seven-step, problem-solving methodology just discussed.
System Logging (SYSLOG)Logging is an extremely useful troubleshooting tool that enables the router to keep track of events that occur within the router. There are several different options available when configuring this feature. The two major options are allowing the router to have the capability to record events in either the router’s buffer or to send them to a SYSLOG server or both. This flexibility is very useful, as it enables you to see if events that are occurring within your network are related to the router’s operation or if the router has detected a network event. This can help you find trends, system error messages, outages, and a variety of other network events. Configuring SYSLOG The first step in getting the router to start logging requires a decision on your part. Eight possible level settings enable you to limit how the events within the router are logged. To configure the router option, you will need to enter the global configuration mode as shown in the following example. OSPF_Router(config)#logging console ? alerts Immediate action needed critical Critical conditions debugging Debugging messages emergencies System is unusable errors Error conditions informational Informational messages notifications Normal but significant conditions warnings Warning conditions
|
EAN: 2147483647
Pages: 200