Troubleshooting Locking and Blocking
| For a lot of database applications, performance degrades as the number of concurrent users increases. One of the common reasons for this behavior is blocking. Whenever two connections or system process IDs (SPIDs) try to access a common database resource in a conflicting way, the SQL Server lock manager ensures that the second SPID waits until the first SPID completes its work. This helps in maintaining data consistency. Poor query and transaction design can lead to excessive locking and blocking, significantly degrading system performance and affecting the scalability of the system. Traditional techniques for blocking analysis include using sysprocesses and syslockinfo system tables, sp_lock and sp_who2 system stored procedures, the DBCC INPUTBUFFER statement, and Profiler trace. Microsoft released a sample script (see Knowledge Base article 271509) that uses these techniques to monitor blocking. Some of the techniques used to reduce blocking include keeping transactions short, optimizing queries by using indexes, using covering indexes, using a different (lower) isolation level, partitioning the data, and so on. In SQL Server 2005, you can continue to use these techniques to minimize the blocking and thereby increase the concurrency. The following sections outline some new techniques that you can implement in SQL Server 2005 to proactively monitor and troubleshoot blocking scenarios. Using the Blocked Process Threshold OptionSQL Server 2005 introduces a new advanced system configuration (sp_configure) option called "blocked process threshold." You can use this option to proactively monitor blocking and deadlocking instances. You can use sp_configure to set the blocked process threshold to an integer value between 0 (the default) and 86400 (24 hours). Let's assume that you set the blocked process threshold configuration value to 10. Now, if there is a blocking for over 10 seconds, SQL Server will raise an event that can be captured by using the SQL Server event notification mechanism to perform an action, and the event can also be seen in SQL Profiler. The event is raised every 10 seconds after that until the blocking is resolved. Let's look at an example of using the blocked process threshold configuration option to monitor blocking. In this example, the blocked process threshold is set to 10, and then a blocking scenario is created. In response to a blocking event generated by SQL Server, an entry is made into an audit table. You can handle the event differently and do things such as notify a DBA or do something to resolve the blocking. For simplicity, this example makes an entry into an audit table whenever the blocked process threshold event is raised. The following code block shows how you set the blocked process threshold configuration option to 10 seconds: USE master; GO EXEC master.dbo.sp_configure 'show advanced options', 1; RECONFIGURE WITH OVERRIDE; EXEC master.dbo.sp_configure 'blocked process threshold', 10; RECONFIGURE WITH OVERRIDE; EXEC master.dbo.sp_configure 'show advanced options', 0; RECONFIGURE WITH OVERRIDE;Next, you should create an audit table that will be used to record the blocking instances: IF OBJECT_ID('dbo.tblBlocking') IS NOT NULL DROP TABLE dbo.tblBlocking; GO CREATE TABLE dbo.tblBlocking (id INT IDENTITY(1,1) NOT NULL PRIMARY KEY, server_name VARCHAR(100) NULL, blocker_spids VARCHAR(8000) NULL, event_info xml NULL, date_time DATETIME NOT NULL DEFAULT GETDATE()); GOSQL Server raises the BLOCKED_PROCESS_REPORT event when there is a blocking for 10 seconds and every 10 seconds after that until blocking is resolved. This event can be captured by using the event notification mechanism introduced in SQL Server 2005. The event notification mechanism captures the event and notifies a Service Broker service by placing a message in the queue. In this example, a stored procedure is associated with the queue and activated whenever there is a message in the queue. Service Broker is discussed in great detail in Chapter 14, "SQL Server 2005 Service Broker." In summary, SQL Server raises the BLOCKED_PROCESS_REPORT event, which is captured by the event notification mechanism, which places a message in the Service Broker queue, which in turn activates the stored procedure, which finally makes an entry into the audit table. Here is the stored procedure that is activated whenever there is a new message in the queue (created later in this example) in response to the BLOCKED_PROCESS_REPORT event: IF OBJECT_ID('dbo.sp_NotifyBlocking') IS NOT NULL DROP PROCEDURE dbo.sp_NotifyBlocking; GO CREATE PROCEDURE dbo.sp_NotifyBlocking AS BEGIN --Find blocked process chain DECLARE @probclients TABLE(spid SMALLINT, ecid SMALLINT, blocked SMALLINT, waittype BINARY(2), dbid SMALLINT, PRIMARY KEY (blocked, spid, ecid)); INSERT @probclients SELECT spid, ecid, blocked, waittype, dbid FROM master.dbo.sysprocesses WHERE blocked != 0 OR waittype != 0x0000; INSERT @probclients SELECT DISTINCT blocked, 0, 0, 0x0000, 0 FROM @probclients WHERE blocked != 0 AND blocked NOT IN (SELECT spid FROM @probclients); DECLARE @HeadBlockerSPIDs varchar(4000) SELECT @HeadBlockerSPIDs = COALESCE(@HeadBlockerSPIDs + ', ', '') + CAST(spid AS varchar(5)) FROM @probclients WHERE blocked = 0 AND spid in (SELECT blocked FROM @probclients WHERE spid != 0); --Receive message from the queue DECLARE @QMessage XML DECLARE @SBMessage TABLE (msgText XML); RECEIVE CAST(message_body AS XML) AS msgText FROM AdventureWorks.dbo.BlockingMonitoringQueue INTO @SBMessage; SELECT TOP 1 @QMessage = msgText FROM @SBMessage; --Insert into audit table INSERT INTO master.dbo.tblBlocking (server_name, blocker_spids, event_info) VALUES (@@SERVERNAME, @HeadBlockerSPIDs, @QMessage); END; GOThis stored procedure is activated in response to the blocking event. It uses the master.dbo.sysprocesses backward compatibility view to determine the blocking chain, including the head blocker process. Toward the end, the stored procedure retrieves the message from the Service Broker queue and inserts the queue message, along with blocked process chain information, into an audit table. The final configuration step required is to enable Service Broker in the user database, create Service Broker objects such as the service and the queue, and set up the event notification to respond to the BLOCKED_PROCESS_REPORT event. Here's how you do that: IF NOT EXISTS (SELECT * FROM sys.databases WHERE name = 'AdventureWorks' AND is_broker_enabled = 1) ALTER DATABASE AdventureWorks SET ENABLE_BROKER ; GO USE AdventureWorks; GO IF EXISTS(SELECT * FROM sys.services WHERE name = 'BlockingMonitoringService') DROP SERVICE BlockingMonitoringService ; GO IF OBJECT_ID('[dbo].BlockingMonitoringQueue') IS NOT NULL AND EXISTS(SELECT * FROM sys.service_queues WHERE name = 'BlockingMonitoringQueue') DROP QUEUE [dbo].BlockingMonitoringQueue; GO CREATE QUEUE dbo.BlockingMonitoringQueue -- Activation turned on WITH STATUS = ON, ACTIVATION ( -- The name of the proc to process messages for this queue PROCEDURE_NAME = master.dbo.sp_NotifyBlocking, -- The maximum number of copies of the proc to start MAX_QUEUE_READERS = 5, -- Start the procedure as the user who created the queue. EXECUTE AS SELF ) ON [DEFAULT] ; GO CREATE SERVICE [BlockingMonitoringService] ON QUEUE BlockingMonitoringQueue ([http://schemas.microsoft.com/SQL/Notifications/PostEventNotification]); GO IF EXISTS(SELECT * FROM sys.server_event_notifications WHERE name = 'EventNotifyBlocking') DROP EVENT NOTIFICATION EventNotifyBlocking ON SERVER ; GO CREATE EVENT NOTIFICATION EventNotifyBlocking ON SERVER FOR BLOCKED_PROCESS_REPORT TO SERVICE 'BlockingMonitoringService', 'current database'; GO These statements first enable Service Broker in the AdventureWorks sample database, in which the blocking scenario will be created later in this example. Next, they create a Service Broker queue with activation enabled, as well as a service. Toward the end, an event notification mechanism is set up to monitor BLOCKED_PROCESS_REPORT and send the event notification to the BlockingMonitoringService Service Broker service in the current database. You can run the preceding script statements to set up the blocking monitoring process. Next, you should open two query windows in SQL Server Management Studio and run the following two scripts simultaneously to create the blocking scenario: Connection 1: USE [AdventureWorks]; GO SET TRANSACTION ISOLATION LEVEL READ COMMITTED; GO BEGIN TRANSACTION; GO Connection 2: USE [AdventureWorks]; GO SET TRANSACTION ISOLATION LEVEL READ COMMITTED; GO BEGIN TRANSACTION; GO UPDATE Production.ProductInventory SET Quantity = Quantity - 1 WHERE ProductID = 1; GO Next, you should switch back to Connection 1, run the following SELECT statement, and notice that it is blocked by Connection 2 because Connection 2 updated the information inside a transaction that Connection 1 is trying to access: Connection 1: SELECT SUM(Quantity) FROM Production.ProductInventory WHERE ProductID = 1; GO Note This SELECT statement does not cause blocking if row versioning (discussed next) is enabled. You should run the following statement and ensure that it returns 0: SELECT is_read_committed_snapshot_on FROM sys.databases WHERE name = 'AdventureWorks'; If this statement returns 1, you know that row versioning is enabled, and in such cases, the preceding SELECT statement will run successfully, without any blocking. Then you should turn off the READ_COMMITTED_SNAPSHOT database option by using the ALTER DATABASE statement to disable row versioning. You should let Connection 1 be blocked for about 40 to 50 seconds. Then you should switch to Connection 2 and run ROLLBACK TRANSACTION; after this, you should notice that Connection 1 is no longer blocked. You should run ROLLBACK TRANSACTION in Connection 1 as well to end the transaction. Then, when you select the rows from the master.dbo.tblBlocking audit table, you should see a few rows in this table indicating one or more processes in the chain that caused the blocking. While Connection 1 is blocked, you may also run Profiler and select "Blocked Process Report" under "Errors and Warning." Every time SQL Server raises the BLOCKED_PROCESS_REPORT event, you should then see an entry in Profiler, showing the blocking information in XML format. When you're done with this example, you can reset "the blocked process threshold" sp_configure setting to 0 and drop the Service Broker objects, event notification, and audit table. The blocked process threshold option is an example of how SQL Server 2005 is changing the performance monitoring and tuning paradigm for you to be proactive so that you no longer simply react to performance issues. Row Versioning and Snapshot IsolationThe SQL Server 2005 row versioning feature can significantly reduce the occurrences of blocking and deadlocking. You can enable the row versioning feature for a database by doing either of the following:
When row versioning is enabled, whenever a transaction modifies a row, SQL Server uses the tempdb system database to maintain a copy of the original row (that is, a before image of the row). If multiple transactions modify a row, multiple versions of the row are stored in a version chain. For short-running transactions, a version of a modified row may get cached in the buffer pool without getting written into the tempdb database. If the need for the versioned row is short, the row will simply get dropped from the buffer pool. The read request is served by traversing the version link list to retrieve the last version of each row that was committed when the read transaction or statement started. By keeping versions of updated rows, SQL Server avoids the need to lock the data, and it still maintains the data consistency. When row versioning is enabled, the number of deadlocks is reduced, and the number of locks required by a transaction is reduced, thereby reducing the system overhead required to manage locks; in this case, fewer lock escalations take place. If row versioning is enabled, you must ensure that there is adequate space in tempdb to maintain the rows version store. Let's look at an example of how row versioning helps in reducing blocking and increasing concurrency. You should run the following statement to see whether row versioning is enabled for the AdventureWorks sample database: SELECT is_read_committed_snapshot_on FROM sys.databases WHERE name = 'AdventureWorks';If this statement returns 1, it indicates that transactions that use the READ COMMITTED (the default) isolation level will use row versioning to prevent readers from blocking the writers and vice versa, without locking any rows. If the preceding statement returns 0, you should run the following command to enable row versioning for the AdventureWorks sample database: ALTER DATABASE AdventureWorks SET READ_COMMITTED_SNAPSHOT ON;Before you run this statement, you need to make sure no users are connected to the AdventureWorks sample database. After you enable the READ_COMMITTED_SNAPSHOT option for the AdventureWorks database, you should run the preceding SELECT statement on the sys.databases catalog view to verify that row versioning is enabled. Next, you should try to create the same blocking scenario explained earlier in this chapter, in the section "Using the Blocked Process Threshold Option." You will notice that, even though transactions are using the READ COMMITTED isolation level, readers are not blocking the writers and vice versa. Analyzing Deadlocks by Using SQL ProfilerIn SQL Server 2005, SQL Profiler has been enhanced to better assist in troubleshooting deadlock scenarios. You can use the new "Deadlock Graph" trace event under "the Locks" event class to view deadlock information graphically or as an XML document (see Figure 9.2). Figure 9.2. Profiler shows the deadlock information graphically and as an XML document.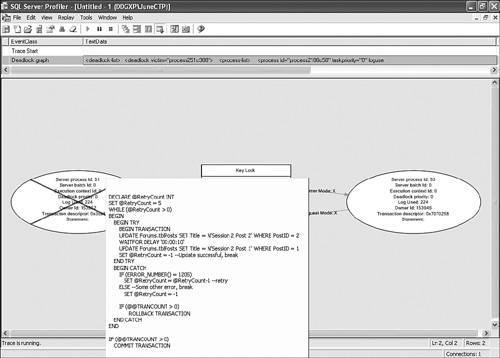 Chapter 5 contains a script that can be used to simulate a deadlock scenario. As shown in Figure 9.2, Profiler shows the SPIDs involved in the deadlock. When you hover the mouse over each process (shown as a circle in a graph), Profiler shows the T-SQL statements that the process was executing when the deadlock happened. The circle with the blue X lines indicates the process that was selected as a deadlock victim. The Textdata column contains the deadlock information as an XML document. You can right-click this column and select "Extract Event Data" to save the deadlock XML document to a disk file. Locking and Blocking Monitoring ToolsIn SQL Server 2005, Activity Monitor has been enhanced to support filtering and automatic refreshing. You can launch Activity Monitor from SQL Server Management Studio by connecting to a SQL Server instance by using Object Explorer, expanding the Management folder, and then double-clicking the Activity Monitor node. Figure 9.3 shows the redesigned Activity Monitor window: Figure 9.3. Activity Monitor now supports filtering and automatic refreshing.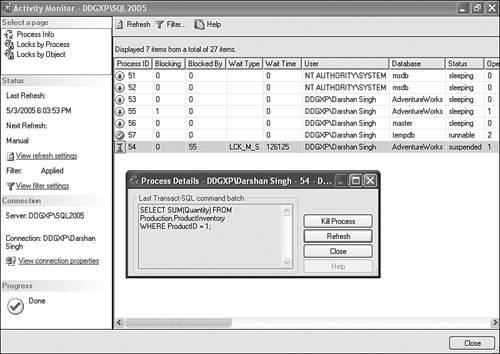 You can continue to use the T-SQL constructs sp_who, sp_who2, sp_lock, DBCC INPUTBUFFER, and so on to monitor and troubleshoot blocking. You can also use the following DMVs and dynamic management functions (DMFs) to further obtain the information on processes and locks:
Let's look at an example of using these DMVs and DMFs to obtain information about long-running queries. You can run the following script to create a stored procedure that performs a long-running operation: Connection 1: USE AdventureWorks; GO IF OBJECT_ID ('dbo.sprocTest') IS NOT NULL DROP PROCEDURE dbo.sprocTest; GO CREATE PROCEDURE dbo.sprocTest AS BEGIN DECLARE @i INT SET @i = 0 WHILE @i < 5000 BEGIN SELECT TOP (@i) Name FROM Sales.Store; SET @i = @i + 1; END; END; GOThen you open another query window and type the following T-SQL batch, but don't run the following script yet: Connection 2: USE AdventureWorks; GO DECLARE @SessionID INT DECLARE @SQLHandle varbinary(64) DECLARE @PlanHandle varbinary(64) SELECT TOP 1 @SessionID = session_id FROM sys.dm_exec_requests ORDER BY total_elapsed_time DESC; SELECT @SQLHandle = sql_handle FROM sys.dm_exec_requests WHERE session_id = @SessionID; SELECT @PlanHandle = plan_handle FROM sys.dm_exec_requests WHERE session_id = @SessionID; SELECT @SQLHandle AS SQLHandle; SELECT @PlanHandle AS PlanHandle; SELECT DB_NAME(dbid) AS [db_name], OBJECT_NAME(objectid) AS obj_name, number, encrypted, [text] FROM sys.dm_exec_sql_text(@SQLHandle); SELECT query_plan FROM sys.dm_exec_query_plan(@PlanHandle); SELECT * FROM sys.dm_exec_query_stats WHERE plan_handle = @PlanHandle; SELECT * FROM sys.dm_tran_locks WHERE request_session_id = @SessionID; GO This T-SQL script first uses the sys.dm_exec_requests DMV to obtain the SPID or session ID for the longest-running request. This session ID is then used to obtain the plan handle and SQL handle, which are then used to obtain the query text, query plan, and query stats information. You need to now execute the stored procedure in Connection 1: Connection 1: EXEC dbo.sprocTest; GO Then you should run the T-SQL batch in Connection 2 to obtain the information about the longest-running request. |
EAN: 2147483647
Pages: 150