| SQL Server 2005 provides a number of tools you can use to proactively monitor SQL Server, perform trend analysis, troubleshoot performance issues, and maximize the SQL Server performance. The SQL Profiler and PerfMon (also known as System Monitor) are still the primary tools for tracing and monitoring the SQL Server performance and system throughout. These two tools have been upgraded to support new SQL Server 2005 features and to provide more useful information to aid in troubleshooting performance issues. In addition to using Profiler and PerfMon, other performance monitoring techniques include running system stored procedures such as sp_who2, sp_monitor, and sp_lock; running DBCC commands such as DBCC MEMORYSTATUS; accessing dynamic management views (DMVs) and dynamic management functions (DMFs) to view the current state of the SQL Server 2005 system; generating client statistics and execution plans by using Query Editor in SQL Server Management Studio; using Activity Monitor inside Management Studio; implementing DDL triggers and the event notificationbased monitoring system; and using command-line tools such as SQLDiag.exe to obtain detailed system information. These techniques are discussed in detail in Chapter 9, "Performance Analysis and Tuning." SQL Server 2005 Profiler SQL Server 2005 Profiler (Profiler90.exe) is a graphical tool you use to trace T-SQL or MDX queries being submitted to the server. You can use Profiler to find out about slow-performing queries and stored procedures, to trace locking and deadlocking issues, and to audit SQL Server activity. The following are some of the new features introduced in Profiler: Support for SSAS As mentioned earlier, Profiler now allows you to connect to an Analysis Server instance to trace MDX queries being submitted to the server. When you launch Profiler and start a new trace, you can select Analysis Server from the Server Type combo box, provide the credentials, and click Connect. After you click the Connect button, you see the Trace Properties dialog and Analysis Serverspecific trace events in the Events Selection tab. You can select the events you want to monitor and other settings, such as the trace name, the trace template, whether to save to a file or table, and so on and click Run to begin tracing. Saving a trace as an XML file After capturing a trace, you can select File | Save As | Trace XML File to save the captured trace data as an XML file. You can edit this XML file and then use it later for replay. Having trace data available as XML opens up opportunities for third-party application vendors. XML-based trace definitions SQL 2005 Profiler uses XML-based trace definitions to show different events for different types of servers. For instance, if you connect to SQL Server 7, Profiler shows one set of events on the Events Selection tab in the Trace Properties dialog. If you connect to a SQL Server 2000 instance, you see a different set of events that you can capture. Similarly, for SQL Server 2005 and Analysis Services 2005, you see different trace definitions. These trace definition XML files are stored in the Program Files\Microsoft SQL Server\90\Tools\Profiler\TraceDefinitions folder. If you are not running the Profiler on the server itself, these XML files are downloaded to the client machine from where you are running the Profiler tool. This ensures that you have up-to-date trace definition events data from which you can select the events to monitor. Capturing of the showplan for queries executed on the server The showplan is shown graphically in the Profiler, and you can also save that as XML, which you can later load and analyze in Query Editor in Management Studio to view the showplan graphically without connecting to the server. To use this feature, you select the Showplan XML event under the Performance event class in the Events Selection tab on the Trace Properties dialog. After you select this event, a third tab, named Events Extraction Settings, appears, and in it you can optionally select the file in which the Showplan XML event should be saved. This is discussed in detail in the next section. Performance Monitor integration with Profiler This integration allows you to correlate Performance Monitor counter data with the Profiler trace collected at the same time. You select File | Import Performance Data to use this performance counters correlation feature. Enhanced trace replay If you have multiple rollover files, Profiler can now automatically play them one after the other continuously and in order. Profiler also provides options to control the replay options, such as the number of reply threads. Look for these options under Tools | Options. Improved Trace Properties dialog When you connect to a server instance, Profiler brings up the Trace Properties dialog, which allows you to select events to monitor, columns to show, filters to set, and options for saving a trace to a file or a table. The Trace Properties dialog in SQL Server 2000 Profiler contains four tabs: General, Events, Data Columns, and Filters. It is very cumbersome to move back and forth among the Events, Data, and Columns tabs to select and view the events settings. SQL Server 2005 combines these three tabs under a single screen called Events Selection. This dialog now allows you to use a single screen to select events to monitor and columns to view and to set column filters. In addition, the ability to see only selected events and selected columns is a great usability enhancement. You can click the column header or click the Column Filters button to view or edit the column filter settings. When you click the column header, in addition to the filter settings, you can also specify whether Profiler should exclude rows that do not contain any value for that column. Figure 5.8 shows the new Events Selection tab. Figure 5.8. The new Events Selection tab is a single easy-to-use screen that allows you to select events to monitor and columns to view and to set column filters. 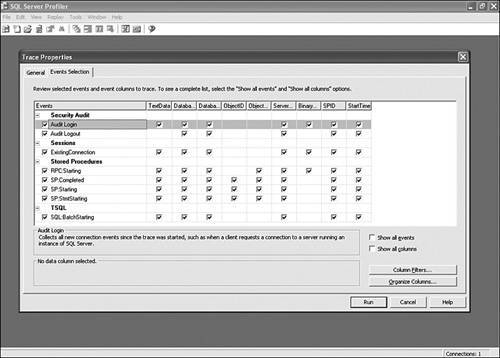
New trace events Profiler contains several new trace events that either support new features or provide better tracing functionality. For instance, you can use the Broker event class to trace Server Broker activity, the Deprecation events to capture features that are deprecated and might not be available at all in future releases, the Progress Report event class to see the status of tasks such as online index building, OLEDB events to capture events raised by any feature (such as linked servers) that makes use of OLEDB, database mirroring events, several new events for full-text searching under the Performance and Full text event classes, new Server trace events such as Mount Tape, new CLR events such as Assembly Load, and so on.
Let's now look at using some of the new Profiler features. The following section shows three examples: how to detect blocking by using SQL Profiler, how to detect deadlock by using Profiler and viewing the deadlock graph, and how to obtain the query showplan as XML by using Profiler. Note The Duration column in the Profiler results shows the amount of time taken by the event. Whereas the SQL Server 2000 Profiler outputs this value in milliseconds, the SQL Server 2005 Profiler outputs this value in microseconds.
The Blocked Process Report Profiler Event SQL Server 2005 introduces a new feature called blocked process report, which is provided via the new sp_configure advanced setting blocked process threshold. This setting has a default value of 0, which means the feature is turned off. You can enable advanced options and then set this option to a numeric value, say 10, to indicate the number of seconds, and then if there is blocking on the server for 10 seconds, SQL Server 2005 will raise an event at that time and every 10 seconds after that until blocking is not resolved. This event can be captured by using the event notification mechanism to run some T-SQL code and also can be seen in Profiler. Here are the steps for capturing a blocked process report event by using Profiler: 1. | Start SQL Server Management Studio and open two query windows. Connect to a SQL Server 2005 instance in each of the query windows.
| 2. | Set the blocked process threshold sp_configure setting to 10 seconds. Execute the following script in one of the query windows:
EXEC sp_configure 'show advanced options', 1; GO RECONFIGURE WITH OVERRIDE; GO EXEC sp_configure 'blocked process threshold', 10; GO RECONFIGURE WITH OVERRIDE; GO EXEC sp_configure; /* --When done with the demo, execute following T-SQL to clean up EXEC sp_configure 'blocked process threshold', 0; GO RECONFIGURE WITH OVERRIDE; GO EXEC sp_configure 'show advanced options', 0; GO RECONFIGURE WITH OVERRIDE; GO */
| 3. | Verify that the run value for blocked process threshold is 10. Clear the query text and type the following T-SQL into in the first query window:
USE [AdventureWorks]; GO SET TRANSACTION ISOLATION LEVEL READ COMMITTED; GO BEGIN TRANSACTION; GO UPDATE Production.ProductInventory SET Quantity = Quantity - 1 WHERE ProductID = 1; GO -- Execute till above line first -- And then run query in second connection -- Finally, To end blocking in other window, execute following code ---------------------------------------------------------- ROLLBACK TRANSACTION; GO SELECT @@TRANCOUNT; GO
| 4. | Type the following T-SQL into in the second query window:
USE [AdventureWorks]; GO SET TRANSACTION ISOLATION LEVEL READ COMMITTED; GO BEGIN TRANSACTION; GO SELECT SUM(Quantity) FROM Production.ProductInventory WHERE ProductID = 1; GO ROLLBACK TRANSACTION; GO SELECT @@TRANCOUNT; GO
Do not run the queries yet. You need to first set up Profiler to capture the blocking event.
| 5. | Start SQL Profiler by running Profiler90.exe or by selecting Start | All Programs | Microsoft SQL Server 2005 | Performance Tools | SQL Server Profiler.
| 6. | Click the New Trace toolbar button or select File | New Trace.
| 7. | Connect to a SQL Server 2005 instance.
| 8. | In the Trace Properties dialog box, select Blank from the Use the Template combo box.
| 9. | Click the Events Selection tab, expand the Errors and Warnings event class, and check the Blocked Process Report event. Click Run to start tracing.
| 10. | In the first query window, execute the queries up to the UPDATE statement. Then execute the entire batch in the second query window. Because the first connection updates the data without committing it and the second connection is trying to access the same data in READ COMMITTED isolation mode, the query blocks on the SELECT statement in the second window. Note that the query in the second connection will not be blocked if the READ_COMMITTED_SNAPSHOT database option is turned on. You can turn off the READ_COMMITTED_SNAPSHOT database option by running the ALTER DATABASE statement.
| 11. | Switch to the Profiler window and wait 10 seconds, and you should see the blocked process report event in the Profiler. The event is generated again every 10 seconds.
| 12. | Switch to the first Query Editor window and roll back the transaction in which the UPDATE statement was executed. This should end the blocking in the second query window, the SELECT statement should execute, and even that transaction should be rolled back. You should not see Blocked Process Report events in the Profiler after this.
| 13. | Reset the sp_configure settings by running the commented query block in the ProfilerSP_Configure.sql script file. Close the Profiler and Management Studio tools.
|
Deadlock Graphs A deadlock occurs when two connections have permanently blocked each other because each connection has a lock on a resource that the other connection is trying to acquire. SQL Server 2000 Profiler contains two events related to deadlocks under the Locks event class: Lock:Deadlock and Lock:Deadlock Chain. The former indicates that the engine has detected a deadlock, and the later results in printing the SPIDs involved in the deadlock. Neither of these events provides any useful information for troubleshooting deadlocks. SQL Server 2005 fixes this by providing detailed deadlock information in the form of XML and also as a graphical picture. Refer to Figure 4.4 in Chapter 4 to see a deadlock graph generated by the Profiler. Here are the steps for generating a deadlock scenario by simultaneously running two query batches in Query Editor windows and by monitoring the Deadlock Graph event in the Profiler: 1. | Start SQL Server Management Studio and open two query windows. Connect to the same SQL Server 2005 instance in both query windows.
| 2. | Type the following script into the first query window:
--Connection 1 USE [tempdb]; GO CREATE SCHEMA Forums; GO CREATE TABLE Forums.tblPosts (PostID INT IDENTITY(1,1) PRIMARY KEY, Title NVARCHAR(256) NOT NULL, Question NTEXT NOT NULL DEFAULT ''); GO INSERT INTO Forums.tblPosts VALUES(N'Post 1', N'Question 1'); INSERT INTO Forums.tblPosts VALUES(N'Post 2', N'Question 2'); GO DECLARE @RetryCount INT SET @RetryCount = 5 WHILE (@RetryCount > 0) BEGIN BEGIN TRY BEGIN TRANSACTION UPDATE Forums.tblPosts SET Title = N'Session 1 Post 1' WHERE PostID = 1 WAITFOR DELAY '00:00:10' UPDATE Forums.tblPosts SET Title = N'Session 1 Post 2' WHERE PostID = 2 SET @RetryCount = -1 --Update successful, break END TRY BEGIN CATCH IF (ERROR_NUMBER() = 1205) SET @RetryCount = @RetryCount - 1 --retry ELSE --Some other error, break SET @RetryCount = -1 IF (@@TRANCOUNT > 0) ROLLBACK TRANSACTION END CATCH END IF (@@TRANCOUNT > 0) COMMIT TRANSACTION DROP TABLE Forums.tblPosts; GO DROP SCHEMA Forums; GO
| 3. | Type the following script into the second query window:
--Connection 2 USE [tempdb]; GO DECLARE @RetryCount INT SET @RetryCount = 5 WHILE (@RetryCount > 0) BEGIN BEGIN TRY BEGIN TRANSACTION UPDATE Forums.tblPosts SET Title = N'Session 2 Post 2' WHERE PostID = 2 WAITFOR DELAY '00:00:10' UPDATE Forums.tblPosts SET Title = N'Session 2 Post 1' WHERE PostID = 1 SET @RetryCount = -1 --Update successful, break END TRY BEGIN CATCH IF (ERROR_NUMBER() = 1205) SET @RetryCount = @RetryCount-1 --retry ELSE --Some other error, break SET @RetryCount = -1 IF (@@TRANCOUNT > 0) ROLLBACK TRANSACTION END CATCH END IF (@@TRANCOUNT > 0) COMMIT TRANSACTION
| 4. | Start SQL Server 2005 Profiler.
| 5. | Click the New Trace toolbar button or select File | New Trace and connect to the same SQL Server 2005 instance as in step 1.
| 6. | On the General tab of the Trace Properties dialog that appears, select Blank from the Use the Template combo box.
| 7. | Click the Events Selection tab. Expand the Locks event class and then check the Deadlock Graph event.
| 8. | Click the Run button on the Trace Properties dialog.
| 9. | Switch back to the Management Studio query windows.
| 10. | Run the entire batch in the first query window and immediately switch to the second query window and run that batch also.
| 11. | Switch back to the Profiler window. Wait about 12 or 15 seconds, and you should see a Deadlock Graph entry in the Profiler window, with a picture shown in the bottom part of that Profiler window and deadlock XML data in the TextData column.
| 12. | The first query window updates the record that has a PostID of 1, and the second query window updates the record that has a PostID of 2. Each waits for 10 seconds and then tries to update the record that is updated by the other query window. Because this all happens within a transaction scope, it creates a deadlock scenario. Close the query windows and Profiler.
|
XML Showplans One of the techniques used to troubleshoot query performance issues is to obtain the detailed query execution plan and study it to find about which query components can be optimized. SQL Server 2000 provides SET statements such as SET SHOWPLAN_TEXT and SET SHOWPLAN_ALL that can be used to obtain query execution plan details. When you turn on these options and then execute the query batch, SQL Server does not actually run the queries, but it returns the execution plan details for the queries. SQL Server 2005 introduces a new SET SHOWPLAN statement option, SET SHOWPLAN_XML, which can be used to obtain the query execution plan as XML text. Let's try it out: 1. | Start a new query window in Management Studio and connect to a SQL Server 2005 instance.
| 2. | Run the SET SHOWPLAN_XML ON statement and then run any query. Instead of executing that query, the Query Editor result window contains execution plan details as XML text.
| 3. | If you are viewing the results in the grid mode, click XML Showplan, and Management Studio launches a new editor window to show the XML results. Save this XML into a text file and give .sqlplan as the file extension.
| 4. | Double-click the .sqlplan file, and the file opens through Management Studio, which shows the execution plan graphically, without even connecting to any server.
|
This can be very useful in tuning queries. You can obtain the same XML showplan by using SQL Server 2005 Profiler. The Profiler also shows the execution plan graphically and also allows viewing and saving the showplan as XML. Here are the steps for obtaining an XML showplan by using Profiler and then viewing the execution plan graphically by using Management Studio: 1. | Start SQL Server Management Studio; open a query window by connecting to a SQL Server 2005 instance.
| 2. | Type the following script into the query window:
USE AdventureWorks; GO DECLARE @countRows INT SET @countRows = 10 SELECT TOP(@countRows) * FROM Production.Product; GO
| 3. | Start SQL Server 2005 Profiler.
| 4. | Click the New Trace toolbar button or select File | New Trace.
| 5. | Connect to a SQL Server 2005 instance.
| 6. | On the General tab of the Trace Properties dialog that appears, select Blank from the Use the Template combo box.
| 7. | Click the Events Selection tab and select Showplan XML under the Performance event class. Check Show Only Selected Events and make sure only one entry is listed.
| 8. | As soon as you click the Showplan XML event, you should see a third tab called Events Extraction Settings on the Trace Properties dialog. Select this tab and check the Save XML Showplan Events Separately check box.
| 9. | Select the path and type a filename in the Save As dialog. The XML Showplan details will be saved in this file. The file will have .SQLPlan as the file extension. Leave the All XML Showplan Batches in a Single File option checked and click the Run button to begin tracing.
| 10. | Switch back to the query window in Management Studio and execute the query batch.
| 11. | Switch back to the Profiler window and stop the trace by clicking the Stop Selected Trace toolbar button or by selecting File | Stop Trace.
| 12. | Start Windows Explorer and browse to the folder that contains the .showplan file generated by the Profiler. Double-click the file to have the file opened in Management Studio. Notice how Management Studio reads the showplan XML file and graphically displays the execution plan.
|
New Performance Monitor Counters Performance Monitor (PerfMon.exe), also known as System Monitor, is a tool that is provided with Windows and can be used to identify bottlenecks in application, database, and resource utilizations. Compared to previous releases, SQL Server 2005 installs several new counters to monitor new subsystems, such as Service Broker, Database Mirroring, HTTP Web Services, Notification Services, Reporting Services, and Database Mail, and it also provides additional information for existing components. The sys.dm_os_performance_counters dynamic management view can be used to see a list of SQL Server performance counters and their current values. You start PerfMon and press Ctrl+I or click the Add toolbar button (the plus sign) to launch the Add Counters dialog. Then you expand the Performance Object combo box to see the new SQL Server 2005 counters. If you have a named instance, then the counters' object names for the relational engine will start with MSSQL$<instance_name>, and SQLAgent$<instance_name> for Agent counters, MSOLAP$<instance_name> for Analysis Server counters, and MSFTESQL$<instance_name> for Full-Text Search counters, and for the default instance, the counter object names will start with SQLServer for Relational Server and Analysis Server for Analysis Services. For each instance of the Notification Services application, PerfMon provides a set of counters that can be used to monitor subscriptions, events, notifications, and so on. All the Notification Services counter object names begin with NS$<app_instance_name>. The Reporting Services counters are provided under the RS Windows Service and RS Web Service objects. The SSIS performance counters are provided under the SQLServer:SSIS Pipeline and SQLServer:SSIS Service objects. Database Engine Tuning Advisor The physical database design is one of the crucial factors on which the performance and manageability of an enterprise database system depends. Therefore, Microsoft wanted to provide an automated physical design tool that DBAs can use to figure out things like what indexes should or should not exist, how and if the data should be partitioned, whether indexed views should be created, and so on. Some of this functionality was provided by the Index Tuning Wizard in SQL Server 2000. In SQL Server 2005, the Index Tuning Wizard has been replaced with a full-fledged application called Database Engine Tuning Advisor (DTA). It's not just a direct replacement of a wizard with an application. Rather, the DTA has significant improvements and contains new features to make better and integrated recommendations for indexes, indexed views, and partitioning. Here are some of the enhancements introduced in the DTA: The DTA can be executed either from a graphical user interface (dtashell.exe) or from the command line (dta.exe). The command-line executable accepts several switches that can be used to configure the tuning settings. The DTA supports tuning multiple databases simultaneously. The DTA is designed to scale well with large databases and workloads, while maintaining good recommendation quality. The DTA achieves this scalability goal by using innovative techniques such as workload compression (looking for "similar" queries to templatize and partition the workload), intelligent algorithms to reduce the number of statistics created, and the ability to tune in a production/test server scenario, which enables tuning a production server while offloading most of the tuning load onto a test server, without actually having the data on the test server. The DTA copies the metadata, necessary statistics, views, stored procedures, triggers, and so on from the production server to the test server, and then it tunes the workload on the test server. When the what-if analysis and tuning are complete on the test server, the recommendation can be applied to the production server. This functionality is provided only via the -ix switch to the DTA command-line executable (dta.exe) and is not available in the DTA graphical user interface. The recommendations made by DTA are not solely based on performance. Rather, they can be based on both performance and manageability. The DTA supports more T-SQL constructs than the Index Tuning Wizard. For instance, your workload can now have table-valued functions and reference a temporary table, and the DTA will be able to consider that, analyze the workload, and make recommendations accordingly. In addition, the DTA can now tune triggers. The DTA allows you to evaluate recommendations and specify which recommendations to implement. You can immediately apply a selected recommendations or schedule it for later, or you can save recommendations to a script file. The input (databases to tune, query workload, and other constraints) and output (physical design recommendations) to the DTA are in XML format with a public schema. The use of XML makes scripting and customization easy and also enables other tools to build value-added functionality on top of the DTA. The XML schema file is named dtaschema.xsd, and it is available in the folder %ProgramFiles%\Microsoft SQL Server\90\Tools\Binn\schemas\sqlserver\2003\03\dta.
The DTA provides richer user interface experience and contains a lot of usability enhancements. Unlike the Index Tuning Wizard, which only sysadmin server role members can use, the DTA can be executed by any members of the db_owner database role. The DTA works very closely with the Query Optimizer. This ensures that the recommendations made by the DTA will actually be effective when the Query Optimizer runs the same workload. Also, as the Query Optimizer's cost model evolves over time, the DTA will be able to automatically benefit from improvements to it. The DTA allows you to control whether the physical database design should be aligned. That is, a table and all its indexes can be partitioned identically, which simplifies the partition management. The DTA has been enhanced to take into consideration the new indexing options, such as online index, non-key columns with nonclustered indexes, and so on. In addition to providing recommendations regarding indexes and indexed views, the DTA can make several other recommendations, such as how to range partition the data, indexes, and indexed views; recommendations on including non-key columns with nonclustered indexes, implementing XML indexes, and index rebuilding/reorganizing suggestions to reduce the cost of index scans and seeks. The DTA provides the ability to limit the tuning time and have the tuning operation end at a particular time. The default is one hour for the graphical tool and 0 for the command-line dta.exe, which means unlimited time. This is useful if you are tuning the production server and want to make sure that the tuning finishes well before your maintenance window ends.
The input to the DTA is one or more user databases on a server, a workload to tune, which can be a SQL script file, a Profiler trace file saved as a .trc or .xml file, a table containing a Profiler trace, features to tune (indexes, indexed views, partitioning, and a combination of these), an optional alignment constraint, an optional time constraint indicating by when the tuning should end, and an optionally bound on the size of the physical design it recommends (for instance, a restriction on the size of indexes). The output of the DTA is a physical design recommendation consisting of indexes (online and offline), indexed views, and partitioning recommendations. Tip For best results, remove any index hints from the query statements in the workload.
Let's now see the DTA in action. Follow these steps to create a large table and optimize the query against this table by using the DTA: 1. | Start SQL Server Management Studio and connect to a SQL Server 2005 instance in a Query Editor mode.
| 2. | Execute the following script in Query Editor:
USE AdventureWorks; GO IF OBJECT_ID('dbo.TestOrderDetails') IS NOT NULL DROP TABLE dbo.TestOrderDetails; GO CREATE TABLE dbo.TestOrderDetails( [SalesOrderID] [int] NOT NULL, [SalesOrderDetailID] [int] NOT NULL, [CarrierTrackingNumber] [nvarchar](25), [OrderQty] [smallint] NOT NULL, [ProductID] [int] NOT NULL, [SpecialOfferID] [int] NOT NULL, [UnitPrice] [money] NOT NULL, [UnitPriceDiscount] [money] NOT NULL, [LineTotal] NUMERIC(17, 2) NULL, [rowguid] [uniqueidentifier], [ModifiedDate] [datetime] NOT NULL); GO DECLARE @counter INT; SET @counter = 1; WHILE @counter <= 10 BEGIN INSERT INTO dbo.TestOrderDetails SELECT * FROM Sales.SalesOrderDetail; SET @counter = @counter + 1; END SELECT COUNT(*) FROM dbo.TestOrderDetails; GO EXEC sys.sp_help 'TestOrderDetails'; GO checkpoint; dbcc freeproccache; dbcc dropcleanbuffers; GO
This script creates a table and copies rows in a loop from an existing table, Sales.SalesOrderDetail, in the AdventureWorks sample database. After you execute this script, you should have a table with about 1,213,170 rows in it.
| 3. | The query workload is a single query to retrieve all orders that have a quantity greater than 20. Let's assume that the following query is available in a file named DTAWorkload.sql:
USE [AdventureWorks]; GO SELECT SalesOrderID, SalesOrderDetailID, OrderQty FROM TestOrderDetails WHERE OrderQty > 20; GO
Run this query and note the time it takes to finish. Also obtain the execution plan for the query by highlighting the query and selecting Query | Display Estimated Execution Plan or by pressing Ctrl+L. Because the table does not have any indexes, the execution plan should show Table Scan as the step taking 100% of the cost. Hover the mouse over the Table Scan icon and note the various parameters, such as I/O Cost, CPU Cost, and Operator Cost. You need to try to optimize this query by using DTA.
| 4. | Start the DTA by running dtashell.exe or selecting Start | All Programs | Microsoft SQL Server 2005 | Performance Tools | Database Engine Tuning Advisor.
| 5. | Connect to the same SQL Server instance as in step 1.
| 6. | A new DTA session should be created by default. If it is not, select File | New Session to start a new DTA tuning session.
| 7. | Type the session name as TestSession.
| 8. | Select DTAWorkload.sql as the workload file.
| 9. | Check AdventureWorks from the list of databases to tune.
| 10. | Expand the Selected Tables list box for AdventureWorks and clear the top check box to unselect all tables. Select TestOrderDetails and click anywhere else on the DTA to close the Selected Tables list box. Ensure that the Selected Tables list box shows that only one table is selected.
| 11. | Select the Tuning Options tab. Check the Indexes radio button from the Physical Design Structure (PDS) to use in database group. Check the No Partitioning radio button from the Partitioning strategy to employ group, and check Do Not Keep Any Existing PDS from the Physical Design Structures (PDS) to Keep in database group.
| 12. | Click Advanced Options to see that the DTA provides options to limit the size of recommendations and that it recommends online or offline indexes. Close the dialog without changing anything.
| 13. | Note the Limit Tuning Time option on the Tuning Options tab. If you would like, uncheck that option.
| 14. | Click the green arrow on the toolbar or select Actions | Start Analysis or press F5 to begin analysis.
After you start the analysis, you should see the Progress tab with the progress indicator. When the tuning is over, you should see two more tabs: Recommendations and Reports. Figure 5.9 shows the Recommendations tab after the analysis is over.
Figure 5.9. Based on the workload and other settings, the DTA recommends creating a nonclustered index with a few other non-key columns included in the index. 
| 15. | You can click the link under the Definition column to see the T-SQL script to implement that recommendation. The check box in the first column lets you choose which recommendations to apply. You can evaluate the recommendations by clicking Actions | Evaluate Recommendations or apply the recommendations by clicking Actions | Apply Recommendations. When you select to evaluate the recommendations, the DTA creates a new session and passes it the configuration XML file that contains the recommendation details. You can view the XML configuration text used for evaluating the recommendation by clicking the Click Here to See the Configuration Section link provided at the bottom of the Workload tab for the new session created for evaluation. You have to provide the session name, start the analysis, and review the reports to see the evaluation results. At this point, you need to just apply the recommendations instead of evaluating them.
| 16. | Select Actions | Save Recommendations to save recommendations as a T-SQL script file. Then select Actions | Apply Recommendations to either apply the recommendations immediately or schedule them to run at a later time, which creates a job with one T-SQL step.
| 17. | After you apply the recommendations, again run the SELECT query in the DTAWorkload.sql file and see how fast it runs. Also obtain the execution plan for the query by highlighting the query and selecting Query | Display Estimated Execution Plan or by pressing Ctrl+L. This time, the execution plan should show Index Seek instead of Table Scan. Hover the mouse over the Index Seek icon and note that parameters such as I/O Cost, CPU Cost, and Operator Cost have gone down significantly.
|
You can import or export the session details as XML by using the File | Import Session Definition and File | Export Session Definition menu items. You can export the analysis results as an XML file by using File | Export Session Results. You can duplicate the DTA session settings by selecting Actions | Clone Session. DTA uses the msdb system database to store session and tuning log result details. You can execute the following query to obtain a list of tables and stored procedures used by the DTA: SELECT * FROM msdb.sys.all_objects WHERE ([name] LIKE 'dta%' OR [name] LIKE 'sp_DTA%') AND ([type] = 'U' OR [Type] = 'P') ORDER BY [name], [type]; GO
|