[Page 510] Membership List. Write a menu-driven program to manage a membership list. See Figure 9.34 Assume that the names and phone numbers of all members are stored in alphabetical order in the text file MEMBERPHONES.TXT. The names and phone numbers should be read into an array of structures, and the names should be displayed in a list box when the form is loaded. When a name is highlighted, both the name and phone number of the person should appear in the text boxes at the bottom of the screen. To delete a person, highlight his or her name and click on the Delete menu item. To change either the phone number or the spelling of the person's name, make the corrections in the text boxes, and click on the menu item Modify. To add a new member, type his or her name and phone number into the text boxes, and click on the menu item Add. When Exit is clicked, the new membership list should be written to the file, and the program should terminate. Figure 9.34. Form for Programming Project 1. 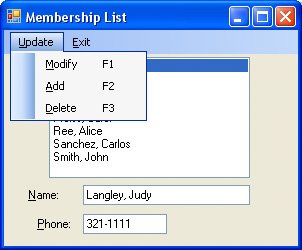 Grade Book. Write a comprehensive program that a professor could use to record student grades for several classes and save the records in sequential files. Each class has three hour exams and a final exam. The file for a single class should consist of the number of students in the class, call it n, and a record of five fields (name, grade1, grade2, grade3, and final) for each student, with the records ordered alphabetically by the student's name. (A typical name might appear as "Doe, John".) Initially, the four grade fields should contain zeros. The program should contain a top-level menu item, File, with second-level subitems for Open, Save, Add Student, and Remove Student. When a file is opened (via an OpenFileDialog control), the data for the students should be loaded into a list box. (The last two columns should remain blank.) The professor should be able to enter (or alter) exam data by double-clicking on a line of the list box to invoke a second form as a customized dialog box for inputting grades. See Figure 9.35 When a student is added, the student is inserted in proper alphabetical position. When the Calculate Semester Grades button is clicked, the last two columns should be filled in by the program. (Assume that the final exam counts as two hour exams.) If a grade is changed after the last two columns have been filled in, the corresponding average and grade should be recomputed.
[Page 511] Figure 9.35. Forms for Programming Project 2. 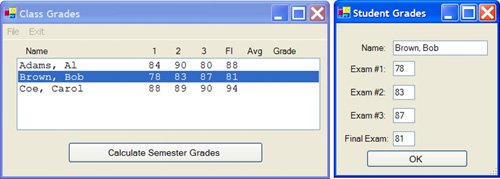 Inventory Control. Write an inventory program for a book store, and save the information in a sequential file. Each record should consist of five fieldstitle, author, category, wholesale price, and number in stock. (The two categories are fiction and nonfiction.) At any time, the program should display the titles of the books in stock in a list box, for which the user should have the option of displaying either all titles or just those in one of the two categories. When a book is selected from the list, its title, author, category, wholesale price, and number in stock should be displayed in a list box. The user should be able to add a new book, delete a book, or change the inventory level of a book in stock. At any time, the user should be able to calculate the total value of all books, or the total value of the books in either category. Voting Machine. The members of the local "Gilligan's Island" fan club bring a computer to their annual meeting to use in the election of a new president. Write a program to handle the election. The program should add each candidate to a list box as he or she is nominated. After the nomination process is complete, club members should be able to approach the computer one at a time and double-click on the candidate of their choice. When a "Tally Votes" button is clicked, a second list box, showing the number of votes received by each candidate, should appear alongside the first list box. Also, the name(s) of the candidate(s) with the highest number of votes should be displayed in a list box. Airplane Seating Chart. An airplane has 15 rows (numbered 1 through 15), with six seats (labeled A, B, C, D, E, and F) in each row. Write a program to display the seating chart in a list box with a line for each row. When the ticket agent clicks on the desired row in the list box, the row number and the status of the seats in the row are displayed in seven read-only text boxes. When the agent clicks on one of the text boxes, a second form containing four option buttons labeled Unoccupied, Regular, Low Calorie, and Vegetarian appears. See Figure 9.36 Clicking on any radio button closes the second form and updates both the text box and the row for that seat in the list box. Unoccupied seats should be denoted with a period, while occupied seats are denoted with the first letter of their meal type. At any time, the agent can request the number of seats filled, the number of window seats vacant, and the numbers of each type of meal ordered.
[Page 512] Figure 9.36. Forms for Programming Project 5. 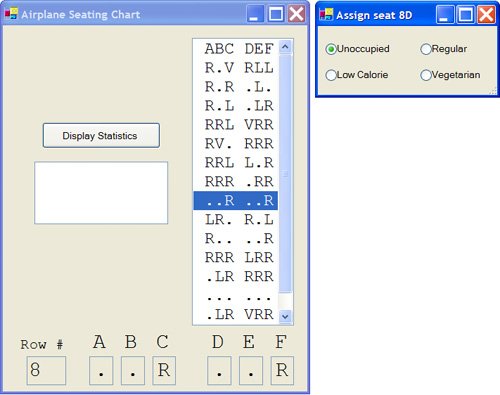 The Underdog and the World Series. What is the probability that the underdog will win the World Series of Baseball? What is the average number of games for a World Series? Write an animated program to answer these questions. For instance, suppose that the underdog is expected to win 40% of the time. We say that the probability of the underdog winning a game is 40%. (Note: In order for a team to be the underdog, the probability that the team wins a game must be less than 50%.) Figure 9.37 shows that the probability that a 40% underdog wins the World Series is about 28.71% and that such a series should be expected to last an average of about 5.69 games. The program should simulate the playing of 10,000 World Series where the underdog has the probability of winning input in the text box. The values of the horizontal scroll bars should extend from 0 to 10,000 and should be calculated after each series so that the scroll boxes steadily move across the bars. Note: In order for the text boxes to the right of the scroll bars to display data as the program progresses (and not just at the end of the program), execute a statement such as txtUnderdog.Refresh in about one-tenth of the 10,000 passes through the loop.
[Page 513] Figure 9.37. A sample run of Programming Project 6. 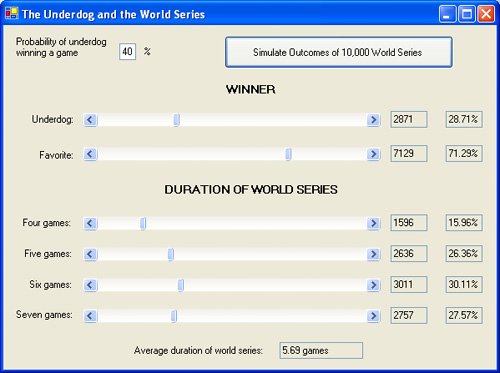 The admissions offices of large colleges often rely on a point system. A point system similar to the one in Figure 9.38 is used by a large state university. Write a program that displays the information in Figure 9.38 and allows an admissions officer to determine whether an applicant should be admitted. The numbers in brackets give the point count for each response. The GPA score displayed in the text box to the right of the horizontal scroll bar should change (from 2.0 to 4.0 in steps of .1) as the user clicks on the bar's right arrow. The point value in the brackets to the right of the text box is 20 times the GPA. A total of at most 40 points can be earned for the responses below the line. The program should calculate the total score and then admit every applicant whose score is at least 100. Figure 9.38. Sample run of Programming Project 7. (This item is displayed on page 514 in the print version) 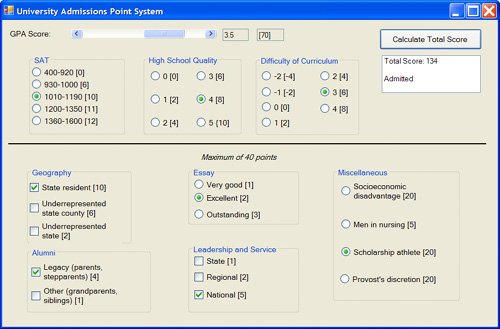 Figure 9.39 is called a range chart. Using the data in Table 9.9, write a program to produce this chart.
[Page 514] Figure 9.39. Range chart for Programming Project 8. 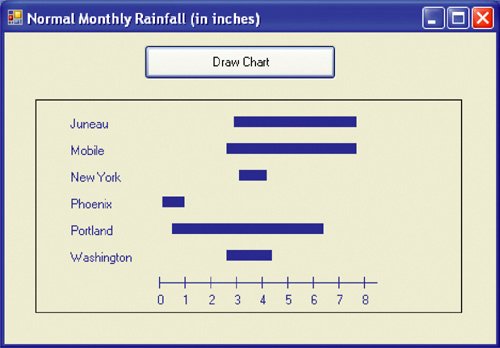 Table 9.9. Range of normal monthly rainfall for selected cities (in inches). (This item is displayed on page 513 in the print version) | | Lowest NMR | Highest NMR |
|---|
Mobile | 2.6 | 7.7 | Portland | .5 | 6.4 | Phoenix | .1 | 1.0 | Washington | 2.6 | 4.4 | Juneau | 2.9 | 7.7 | New York | 3.1 | 4.2 |
[Page 515]A community of 10,000 individuals is exposed to a flu epidemic in which infected individuals are sick for two days and then are immune from the illness. When we first start to observe the epidemic (that is, on day 0), 200 people have had the illness for one day, and 100 people have had the illness for two days. At any time, the rate at which the epidemic is spreading is proportional to the product of the number currently ill and the number susceptible. Specifically, each day
[# of individuals in the first day of the illness] =
CInt(0.0001735 * [# sick the previous day] * [# susceptible the previous day])
Write a program that displays successive bar graphs illustrating the progress of the epidemic. When the "Show Day 0" button is pressed, the bar graph should show the distribution for day 0 (Figure 9.40). Each time the "Advance One Day" button is pressed, a bar graph showing the distribution for the next day should appear. Figure 9.41 shows the bar graph after this button has been pressed three times.
Figure 9.40. Initial distribution. 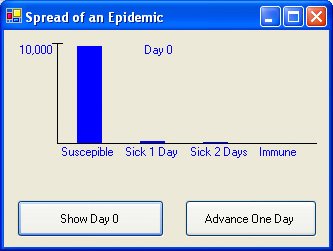
Figure 9.41. Distribution on day 3 of epidemic. 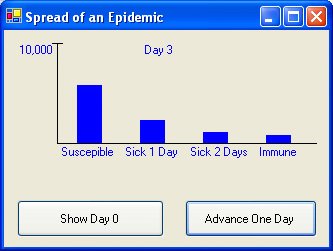
|