Section 7.5. Two-Dimensional Arrays
7.5. Two-Dimensional ArraysEach array discussed so far held a single list of items. Such array variables are called one-dimensional arrays or single-subscripted variables. An array can also hold the contents of a table with several rows and columns. Such arrays are called two-dimensional arrays or double-subscripted variables. Two tables follow. Table 7.9 gives the road mileage between certain cities. It has four rows and four columns. Table 7.10 shows the leading universities in three disciplines. It has three rows and five columns. Two-dimensional array variables store the contents of tables. They have the same types of names as other array variables. The only difference is that they have two subscripts, each with its own upper bound. The first subscript is determined by the number of rows in the table, and the second subscript is determined by the number of columns. The statement Dim arrayName(m, n) As varTypedeclares an array of type varType corresponding to a table with rows labeled from 0 to m and columns labeled from 0 to n. The entry in the jth row, kth column is arrayName(j, k). For instance, the data in Table 7.9 can be stored in an array named rm(). The statement Dim rm(3, 3) As Doublewill declare the array. Each element of the array has the form rm(row, column). The values of the elements of the array we use will be
The data in Table 7.10 can be stored in a two-dimensional string array named univ(). The appropriate array is declared with the statement Dim univ(2, 4) As StringSome of the entries of the array are univ(0, 0) = "U of PA" univ(1, 2) = "UC Berk" univ(2, 4) = "CO Sch. of Mines" Example 1. | ||||||||||||||||||||||||||||||||||||||||||||||||||||||||||||||||||||||||||||||||||||||||||||||||||||||||||||||||||||||||||||||||||||||||||||||||||||||||||||||||||||||||||||||||||||||||||||||||||||||||||||||||||||||||||||||||||||||||||||||||||||||||||||||||||||||||||||||||||||||||||||||||||||||||||||||||||||||||||||||||||||||||||||||||||||||||||||||||||||||||||||||||||||||||||||||||||||||||||||||||||||||||||||||||||||||||||||||||||||||||||||||||||||||||||||||||||||||||||||||||||||||||||||||||||||||||||||||||||||||||||||||||||||||||||||||||||||||||||||||||||||||||||||||||||||||||||||||||||||||||||||||||||||||||||||||||||||||||||||||||||||||||||||||||||||||||||||||||||||||||||||||||||||||||||||||||||||||||||||||||||||||||||||||
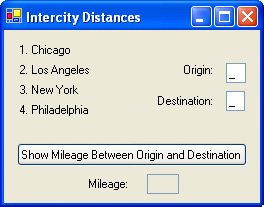
| The following program stores and accesses the data from Table 7.9. Data are read from the text file DISTANCE.TXT into a two-dimensional class-level array using a pair of nested loops. The outer loop controls the rows, and the inner loop controls the columns.
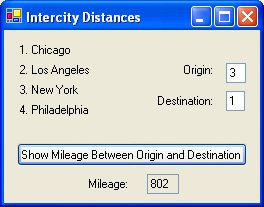
Dim rm(3, 3) As Double Private Sub frmDistances_Load(...) Handles MyBase.Load 'Fill two-dimensional array with intercity mileages 'Assume the data has been placed in the file "DISTANCE.TXT" '(First four lines of the file contain the numbers 0, 2054, 802, 738) Dim sr As IO.StreamReader = IO.File.OpenText("DISTANCE.TXT") [Run, type 3 into the Origin box, type 1 into the Destination box, and click the button.] |
An unsized two-dimensional array can be declared with a statement of the form
Dim arrayName(,) As varType and a two-dimensional array can be declared and initialized at the same time with a statement of the form
Dim arrayName(,) As varType = {{ROW0}, {ROW1},... {ROWm}} where ROW0 consists of the entries in the top row of the corresponding table separated by commas, ROW1 consists of the entries in the next row of the corresponding table separated by commas, and so on. For instance, in Example 1, the declaration statement and frmDistances_Load event procedure can be replaced by the single statement
Dim rm(,) As Double = {{0, 2054, 802, 738}, _ {2054, 0, 2786, 2706}, {802, 2786, 0, 100}, _ {738, 2706, 100, 0}}
An already-created array can be resized with
ReDim arrayName(r, s) which loses the current contents, or with
ReDim Preserve arrayName(r, s) which keeps the current values. However, when the keyword Preserve is used, only the last coordinate can be resized. The upper bound of the first coordinate of the array is given by arrayName.GetUpperBound(0), and the upper bound of the second coordinate is given by arrayName.GetUpperBound(1).
So far, two-dimensional arrays have been used only to store data for convenient lookup. In the next example, an array is used to make a valuable computation.
Example 2. (This item is displayed on pages 380 - 383 in the print version)
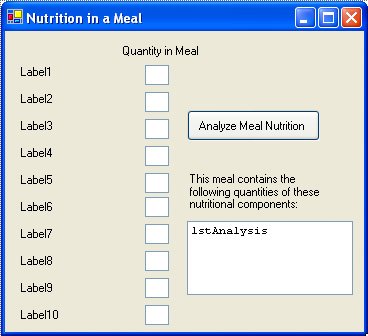
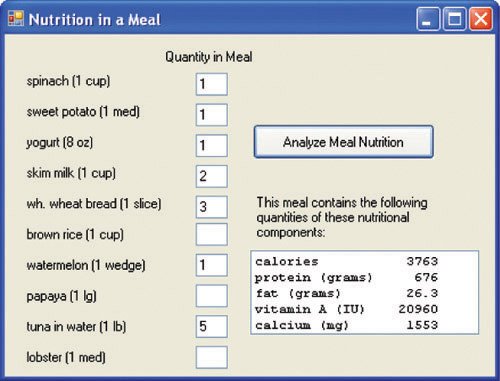
| The Center for Science in the Public Interest publishes The Nutrition Scorebook, a highly respected rating of foods. The top two foods in each of five categories are shown in Table 7.11 along with some information on their composition. The following program computes the nutritional content of a meal. The table is read into an array, and then the program requests the quantities of each food item that is part of the meal. The program then computes the amounts of each nutritional component consumed by summing each column with each entry weighted by the quantity of the food item. Coding is simplified by using an array of labels to hold the food names and an array of text boxes to hold the amounts input by the user. The five nutrients of interest and the actual names and nutrient values of the foods to be used in building a meal are read from the text file NUTTABLE.TXT.
Dim lblarrayFood(9) As Label Dim txtarrayQnty(9) As TextBox Dim nutName(4) As String 'Nutrient names Dim nutTable(9, 4) As Double 'Nutrient values for each food Private Sub frmNutrition_Load(...) Handles MyBase.Load 'Fill arrays, set text for labels lblarrayFood(0) = Label1 lblarrayFood(1) = Label2 lblarrayFood(2) = Label3 lblarrayFood(3) = Label4 lblarrayFood(4) = Label5 lblarrayFood(5) = Label6 lblarrayFood(6) = Label7 lblarrayFood(7) = Label8 lblarrayFood(8) = Label9 lblarrayFood(9) = Label10 txtarrayQnty(0) = TextBox1 txtarrayQnty(1) = TextBox2 txtarrayQnty(2) = TextBox3 txtarrayQnty(3) = TextBox4 txtarrayQnty(4) = TextBox5 txtarrayQnty(5) = TextBox6 txtarrayQnty(6) = TextBox7 txtarrayQnty(7) = TextBox8 txtarrayQnty(8) = TextBox9 txtarrayQnty(9) = TextBox10 [Run, type quantities into the text boxes, and press the button.] |
Comments
We can define three- (or higher-) dimensional arrays much as we do two-dimensional arrays. A three-dimensional array uses three subscripts, and the assignment of values requires a triple-nested loop. As an example, a meteorologist might use a three-dimensional array to record temperatures for various dates, times, and elevations. The array might be created by the statement
Dim temps(31, 24, 14) As DoubleA ReDim statement cannot change the number of dimensions of an array. For instance, it cannot change a one-dimensional array into a two-dimensional array.
Practice Problems 7.5
| 1. | Consider the road-mileage program in Example 1. How can the program be modified so the actual names of the cities can be supplied by the user? |
| 2. | In what types of problems are two-dimensional arrays superior to arrays of structures? |
Exercises 7.5
In Exercises 1 through 8, determine the output displayed when the button is clicked. All Dim statements for arrays are in the Declarations section of the Code window.
| 1. |
Dim a(20, 30) As Double Private Sub btnDisplay_Click(...) Handles btnDisplay.Click a(3, 5) = 6 a(5, 3) = 2 * a(3, 5) txtOutput.Text = CStr(a(5, 3)) End Sub |
| 2. |
Dim years(100, 50) As Double Private Sub btnDisplay_Click(...) Handles btnDisplay.Click Dim x As Integer = 7, y As Integer = 8 years(x, y) = 1937 txtOutput.Text = CStr(years(7, 8) + 60) End Sub |
| 3. |
Dim w(10, 15) As String Private Sub btnDisplay_Click(...) Handles btnDisplay.Click Dim d As String = "Dorothy", n As Integer = 1 w(1, 1) = d txtOutput.Text = w(n, n) End Sub |
| 4. |
Dim actor(5, 5) As String Private Sub btnDisplay_Click(...) Handles btnDisplay.Click Dim a As Integer = 2, b As Integer = 3, temp As Integer actor(a, b) = "Bogart" temp = a a = b b = temp lstOutput.Items.Add("1. " & actor(a, b)) lstOutput.Items.Add("2. " & actor(b, a)) End Sub |
| 5. |
Dim a(,) As Integer Private Sub btnDisplay_Click(...) Handles btnDisplay.Click Dim p, q, sum As Integer Dim sr As IO.StreamReader = IO.File.OpenText("DATA.TXT") p = CInt(sr.ReadLine) q = CInt(sr.ReadLine) ReDim a(p, q) For j As Integer = 0 To p sum = 0 (Assume that the eight lines of the file DATA.TXT contain the following data: 1, 2, 4, 1, 6, 5, 8, 2.) |
| 6. |
Dim a(3, 4) As Integer Private Sub btnDisplay_Click(...) Handles btnDisplay.Click Dim row As String For j As Integer = 0 To 3 row = "" For k As Integer = 0 To 4 a(j, k) = j + k row &= a(j, k) & " " Next lstOutput.Items.Add(row) Next End Sub |
| 7. |
Dim s(2, 2) As Double Private Sub btnDisplay_Click(...) Handles btnDisplay.Click Dim sr As IO.StreamReader = IO.File.OpenText("DATA.TXT") For j As Integer = 0 To 2 For k As Integer = 0 To 2 s(j, k) = CDbl(sr.ReadLine) Next Next sr.Close() For j As Integer = 0 To 2 lstOutput.Items.Add(s(j, j)) Next End Sub (Assume that the nine lines of the file DATA.TXT contain the following entries: 1, 2, 3, 4, 3, 2, 3, 4, 5.) |
| 8. |
Dim m(,) As Integer Private Sub btnDisplay_Click(...) Handles btnDisplay.Click Dim x, y As Integer Dim sr As IO.StreamReader = IO.File.OpenText("DATA.TXT") x = CInt(sr.ReadLine) y = CInt(sr.ReadLine) ReDim m(x, y) (Assume that the 10 lines of the file DATA.TXT contain the following entries: 1, 2, 6, 3, 2, 1, 3, 4, 9, 8.) In Exercises 9 and 10, identify the errors. |
| 9. |
Dim a(2, 3) As Integer Private Sub btnDisplay_Click(...) Handles btnDisplay.Click 'Fill an array Dim sr As IO.StreamReader = IO.File.OpenText("DATA.TXT") For j As Integer = 0 To 3 For k As Integer = 0 To 2 a(j, k) = CInt(sr.ReadLine) Next Next sr.Close() End Sub (Assume that the 12 lines of the file DATA.TXT contain the following entries: 1, 2, 3, 4, 5, 6, 7, 8, 9, 0, 1, 2.) |
| 10. |
Dim score(2, 2) As Integer Private Sub frmScores_Load(...) Handles MyBase.Load 'Fill array from text file Dim student As Integer Dim sr As IO.StreamReader = IO.File.OpenText("SCORES.TXT") For j As Integer = 0 To 2 student = CInt(sr.ReadLine) For k As Integer = 0 To 2 score(k, j) = CInt(sr.ReadLine) Next Next End Sub Private Sub btnDisplay_Click(...) Handles btnDisplay.Click 'Report individual scores Dim student, exam As Integer student = CInt(txtStudent.Text) exam = CInt(txtExam.Text) If (student >=0 And student<=2) And (exam>=0 And exam<=2) Then txtOutput.Text = CStr(score(student, exam)) End If End Sub (Assume that the 12 lines of the file SCORES.TXT contain the following data: 0, 80, 85, 90, 1, 72, 80, 88, 2, 87, 93, 90.) |
In Exercises 11 through 14, write a procedure to perform the stated task.
| 11. | Given an array declared with the statement Dim a(10, 10) As Double, set the entries in the jth column to j (for j=0,...,10). |
| 12. | Given an array declared with the statement Dim a(10, 10) As Double, and values assigned to each entry, compute the sum of the values in row 10. |
| 13. | Given an array declared with the statement Dim a(10, 10) As Double, and values assigned to each entry, interchange the values in rows 2 and 3. |
| 14. | Given an array declared with the statement Dim a(3, 45) As Double, and values assigned to each entry, find the greatest value and the places (possibly more than one) at which git occurs. |
In Exercises 15 through 25, write a program to perform the stated task.
| 15. | A company has two stores (1 and 2), and each store sells three items (1, 2, and 3). The following tables give the inventory at the beginning of the day and the amount of each item sold during that day.
| |||||||||||||||||||||||||||||||||||||||||||||||||||||||||||||||||||||||||||||||||||||
| 16. | Table 7.12 gives the results of a survey on the uses of computers in the workplace. Each entry shows the percentage of respondents from the age category that use the computer for the indicated purpose.
| |||||||||||||||||||||||||||||||||||||||||||||||||||||||||||||||||||||||||||||||||||||
| 17. | A university offers 10 courses at each of three campuses. The number of students enrolled in each is presented in Table 7.13.
| |||||||||||||||||||||||||||||||||||||||||||||||||||||||||||||||||||||||||||||||||||||
| 18. | Table 7.14 gives the 2002 and 2003 U.S. sales for the five top restaurant chains.
| |||||||||||||||||||||||||||||||||||||||||||||||||||||||||||||||||||||||||||||||||||||
| 19. | The scores for the top three golfers at the 2005 Buick Invitational are shown in Table 7.15
| |||||||||||||||||||||||||||||||||||||||||||||||||||||||||||||||||||||||||||||||||||||
| 20. | Table 7.16 contains part of the pay schedule for federal employees in Washington, D.C.Table 7.17 gives the number of employees of each classification in a certain division. Place the data from each table into an array and compute the amount of money this division pays for salaries during the year.
| |||||||||||||||||||||||||||||||||||||||||||||||||||||||||||||||||||||||||||||||||||||
| 21. | Consider Table 7.10, the rankings of three university departments. Write a program that places the data into an array, allows the name of a college to be input, and gives the categories in which it appears. Of course, a college might appear more than once or not at all. | |||||||||||||||||||||||||||||||||||||||||||||||||||||||||||||||||||||||||||||||||||||
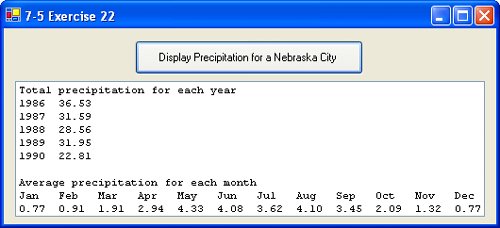
| 22. | Table 7.18 gives the monthly precipitation for a typical Nebraska city during a five-year period. Write a program that reads the table from a text file into an array and then displays in a list box the output on the next page.
 | |||||||||||||||||||||||||||||||||||||||||||||||||||||||||||||||||||||||||||||||||||||
| 23. | Suppose that a course has 15 students enrolled and that five exams are given during the semester. Write a program that accepts each student's name and grades as input and places the names in a one-dimensional array and the grades in a two-dimensional array. The program should then display each student's name and semester average. Also, the program should display the median for each exam. (For an odd number of grades, the median is the middle grade. For an even number of grades, it is the average of the two middle grades.) | |||||||||||||||||||||||||||||||||||||||||||||||||||||||||||||||||||||||||||||||||||||
| 24. | An n-by-n array is called a magic square if the sums of each row, each column, and each diagonal are equal. Write a program to determine if an array is a magic square and use it to determine if either of the following arrays is a magic square. Hint: If, at any time, one of the sums is not equal to the others, the search is complete.
| |||||||||||||||||||||||||||||||||||||||||||||||||||||||||||||||||||||||||||||||||||||
| 25. | A company has three stores (1, 2, and 3), and each store sells five items (1, 2, 3, 4, and 5). The following tables give the number of items sold by each store and category on a particular day, and the cost of each item.
| |||||||||||||||||||||||||||||||||||||||||||||||||||||||||||||||||||||||||||||||||||||
Solutions to Practice Problems 7.5
| 1. | Replace the masked text boxes with ordinary text boxes to hold city names. The function FindCityNum can be used to determine the subscript associated with each city. This function and the modified event procedure btnShow_Click are as follows: Function FindCityNum(ByVal city As String) As Integer Select Case city.ToUpper Case "CHICAGO" Return 1 Case "LOS ANGELES" Return 2 Case "NEW YORK" Return 3 Case "PHILADELPHIA" Return 4 Case Else Return 0 End Select End Function Private Sub btnShow_Click(...) Handles btnShow.Click Dim orig, dest As String Dim row, col As Integer 'Determine road mileage between cities orig = txtOrig.Text dest = txtDest.Text row = FindCityNum(orig) col = FindCityNum(dest) If (row < 1) Or (row > 4) Then MsgBox("City of origin not available", 0, "Error") ElseIf (col < 1) Or (col > 4) Then MsgBox("Destination city not available", 0, "Error") Else txtMiles.Text = CStr(rm(row, col)) End If End Sub |
| 2. | Both arrays of structures and two-dimensional arrays are used to hold related data. If some of the data are numeric and some are string, then structures must be used, because all entries of a two-dimensional array must be of the same type. Arrays of structures should also be used if the data will be sorted. Two-dimensional arrays are best suited to tabular data. |
EAN: 2147483647
Pages: 164