Section 2.2. Programming Tools
2.2. Programming ToolsThis section discusses some specific algorithms and develops three tools used to convert algorithms into computer programs: flowcharts, pseudocode, and hierarchy charts. You use algorithms every day to make decisions and perform tasks. For instance, whenever you mail a letter, you must decide how much postage to put on the envelope. One rule of thumb is to use one stamp for every five sheets of paper or fraction thereof. Suppose a friend asks you to determine the number of stamps to place on an envelope. The following algorithm will accomplish the task.
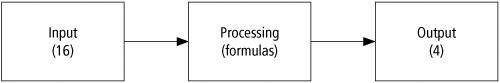
The preceding algorithm takes the number of sheets (Sheets) as input, processes the data, and produces the number of stamps needed (Stamps) as output. We can test the algorithm for a letter with 16 sheets of paper.
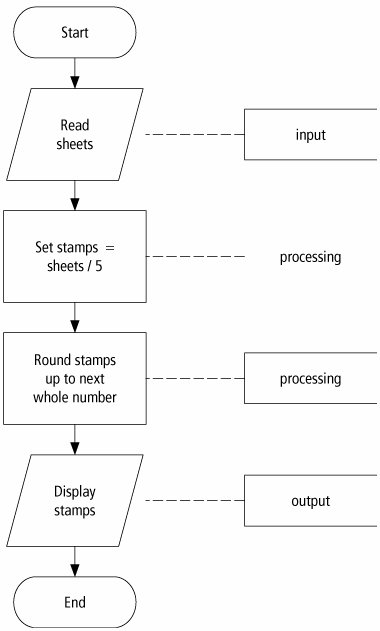
This problem-solving example can be pictured by Of the program design tools available, three popular tools are the following: Flowcharts: Graphically depict the logical steps to carry out a task and show how the steps relate to each other. Pseudocode: Uses English-like phrases with some Visual Basic terms to outline the task. Hierarchy charts: Show how the different parts of a program relate to each other. FlowchartsA flowchart consists of special geometric symbols connected by arrows. Within each symbol is a phrase presenting the activity at that step. The shape of the symbol indicates the type of operation that is to occur. For instance, the parallelogram denotes input or output. The arrows connecting the symbols, called flowlines, show the progression in which the steps take place. Flowcharts should "flow" from the top of the page to the bottom. Although the symbols used in flowcharts are standardized, no standards exist for the amount of detail required within each symbol.  The table of the flowchart symbols shown on the previous page has been adopted by the American National Standards Institute (ANSI). Figure 2.1 shows the flowchart for the postage stamp problem. Figure 2.1. Flowchart for the postage stamp problem. The main advantage of using a flowchart to plan a task is that it provides a pictorial representation of the task, which makes the logic easier to follow. We can clearly see every step and how each is connected to the next. The major disadvantage with flowcharts is that when a program is very large, the flowcharts may continue for many pages, making them difficult to follow and modify. PseudocodePseudocode is an abbreviated plain English version of actual computer code (hence, pseudocode). The geometric symbols used in flowcharts are replaced by English-like statements that outline the process. As a result, pseudocode looks more like computer code than does a flowchart. Pseudocode allows the programmer to focus on the steps required to solve a problem rather than on how to use the computer language. The programmer can describe the algorithm in Visual Basic-like form without being restricted by the rules of Visual Basic. When the pseudocode is completed, it can be easily translated into the Visual Basic language. The following is pseudocode for the postage stamp problem: Program: Determine the proper number of stamps for a letter
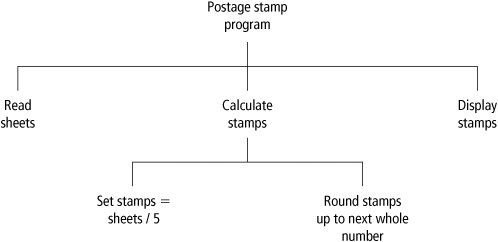
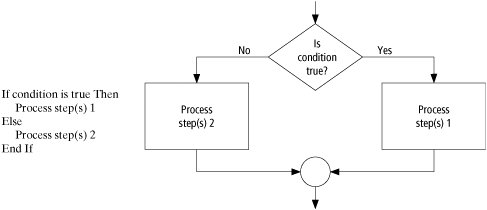
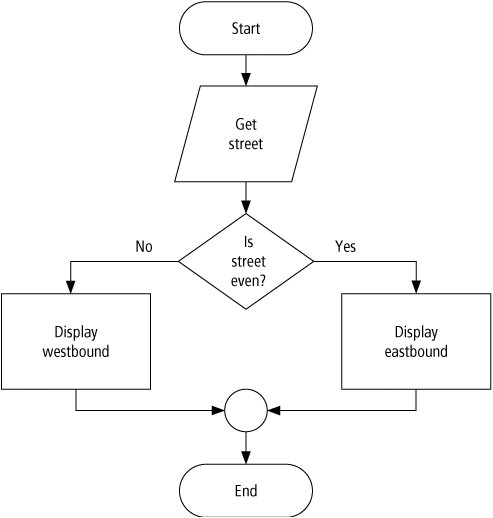
Pseudocode has several advantages. It is compact and probably will not extend for many pages as flowcharts commonly do. Also, the plan looks like the code to be written and so is preferred by many programmers. Hierarchy ChartThe last programming tool we'll discuss is the hierarchy chart, which shows the overall program structure. Hierarchy charts are also called structure charts, HIPO (Hierarchy plus Input-Process-Output) charts, top-down charts, or VTOC (Visual Table of Contents) charts. All these names refer to planning diagrams that are similar to a company's organization chart. Hierarchy charts depict the organization of a program but omit the specific processing logic. They describe what each part, or module, of the program does and they show how the modules relate to each other. The details on how the modules work, however, are omitted. The chart is read from top to bottom and from left to right. Each module may be subdivided into a succession of submodules that branch out under it. Typically, after the activities in the succession of submodules are carried out, the module to the right of the original module is considered. A quick glance at the hierarchy chart reveals each task performed in the program and where it is performed. Figure 2.2 shows a hierarchy chart for the postage stamp problem. Figure 2.2. Hierarchy chart for the postage stamp problem. The main benefit of hierarchy charts is in the initial planning of a program. We break down the major parts of a program so we can see what must be done in general. From this point, we can then refine each module into more detailed plans using flowcharts or pseudocode. This process is called the divide-and-conquer method. The postage stamp problem was solved by a series of instructions to read data, perform calculations, and display results. Each step was in a sequence; that is, we moved from one line to the next without skipping over any lines. This kind of structure is called a sequence structure. Many problems, however, require a decision to determine whether a series of instructions should be executed. If the answer to a question is "Yes," then one group of instructions is executed. If the answer is "No," then another is executed. This structure is called a decision structure. Figure 2.3 contains the pseudocode and flowchart for a decision structure. Figure 2.3. Pseudocode and flowchart for a decision structure. The sequence and decision structures are both used to solve the following problem. Direction of Numbered NYC Streets AlgorithmProblem: Given a street number of a one-way street in New York, decide the direction of the street, either eastbound or westbound. Discussion: There is a simple rule to tell the direction of a one-way street in New York: Even-numbered streets run eastbound. Input: Street number Processing: Decide if the street number is divisible by 2. Output: "Eastbound" or "Westbound" Figures 2.4 through 2.6 show the flowchart, pseudocode, and hierarchy chart for the New York City numbered streets problem. Figure 2.4. Flowchart for the New York City numbered streets problem. |
| Program: Determine the direction of a numbered NYC street. Get street If street is even Then Display Eastbound Else Display Westbound End If |
Figure 2.6. Hierarchy chart for the New York City numbered streets problem. (This item is displayed on page 37 in the print version)

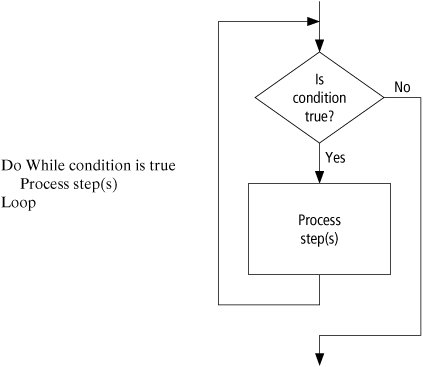
The solution to the next problem requires the repetition of a series of instructions. A programming structure that executes instructions many times is called a loop structure.
We need a test (or decision) to tell when the loop should end. Without an exit condition, the loop would repeat endlessly (an infinite loop). One way to control the number of times a loop repeats (often referred to as the number of passes or iterations) is to check a condition before each pass through the loop and continue executing the loop as long as the condition is true. See Figure 2.7.
Figure 2.7. Pseudocode and flowchart for a loop.
Class Average Algorithm
Problem: Calculate and report the grade-point average for a class.
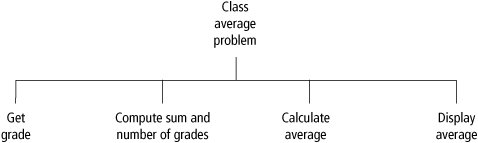
Discussion: The average grade equals the sum of all grades divided by the number of students. We need a loop to read and then add (accumulate) the grades for each student in the class. Inside the loop, we also need to total (count) the number of students in the class. See Figures 2.8 to 2.10.
Figure 2.8. Flowchart for the class average problem. (This item is displayed on page 39 in the print version)
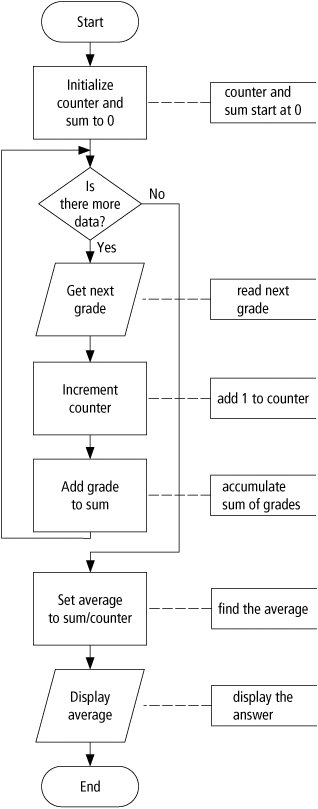
Figure 2.9. Pseudocode for the class average problem. (This item is displayed on page 40 in the print version)
| Program: Calculate and report the average grade of a class. Initialize Counter and Sum to 0 Do While there is more data Get the next Grade Increment the Counter Add the Grade to the Sum Loop Compute Average = Sum/Counter Display Average |
Figure 2.10. Hierarchy chart for the class average problem. (This item is displayed on page 40 in the print version)
Input: Student grades
Processing: Find the sum of the grades; count the number of students; calculate average grade = sum of grades / number of students.
Output: Average grade
Comments
Tracing a flowchart is like playing a board game. We begin at the Start symbol and proceed from symbol to symbol until we reach the End symbol. At any time, we will be at just one symbol. In a board game, the path taken depends on the result of spinning a spinner or rolling a pair of dice. The path taken through a flowchart depends on the input.
The algorithm should be tested at the flowchart stage before being coded into a program. Different data should be used as input, and the output checked. This process is known as desk checking. The test data should include nonstandard data as well as typical data.
Flowcharts, pseudocode, and hierarchy charts are universal problem-solving tools. They can be used to construct programs in any computer language, not just Visual Basic.
Flowcharts are used throughout this text to provide a visualization of the flow of certain programming tasks and Visual Basic control structures. Major examples of pseudocode and hierarchy charts appear in the case studies.
There are four primary logical programming constructs: sequence, decision, loop, and unconditional branch. Unconditional branch, which appears in some languages as Goto statements, involves jumping from one place in a program to another. Structured programming uses the first three constructs but forbids the fourth. One advantage of pseudocode over flowcharts is that pseudocode has no provision for unconditional branching and thus forces the programmer to write structured programs.
Flowcharts are time consuming to write and difficult to update. For this reason, professional programmers are more likely to favor pseudocode and hierarchy charts. Because flowcharts so clearly illustrate the logical flow of programming techniques, however, they are a valuable tool in the education of programmers.
There are many styles of pseudocode. Some programmers use an outline form, whereas others use a form that looks almost like a programming language. The pseudocode appearing in the case studies of this text focuses on the primary tasks to be performed by the program and leaves many of the routine details to be completed during the coding process. Several Visual Basic keywords, such as, If, Else, Do, and While, are used extensively in the pseudocode appearing in this text.
Many people draw rectangles around each item in a hierarchy chart. In this text, rectangles are omitted in order to make hierarchy charts easier to draw and thereby to encourage their use.
EAN: 2147483647
Pages: 164