The Elements of Project Management
| Management is generally perceived to be concerned with the planning, organization, and control of an ongoing process or activity such as the production of a product or delivery of a service. Project management is different in that it reflects a commitment of resources and people to a typically important activity for a relatively short time frame, after which the management effort is dissolved. Projects do not have the continuity of supervision that is typical in the management of a production process. As such, the features and characteristics of project management tend to be somewhat unique. Figure 8.1 provides an overview of project management, which encompasses three major processesplanning, scheduling, and control. It also includes a number of the more prominent elements of these processes. In the remainder of this section we will discuss some of the features of the project planning process. Figure 8.1. The project management process(This item is displayed on page 322 in the print version)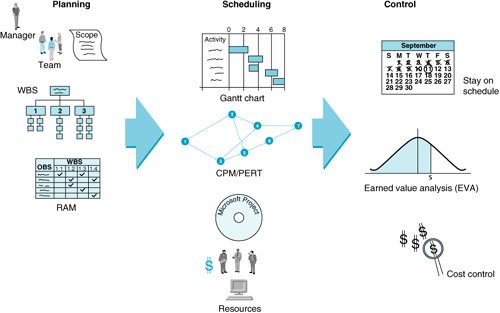 Project PlanningProject plans generally include the following basic elements:
The Project TeamA project team typically consists of a group of individuals selected from other areas in the organization, or from consultants outside the organization, because of their special skills, expertise, and experience related to the project activities. Members of the engineering staff, particularly industrial engineering, are often assigned to project work because of their technical skills. The project team may also include various managers and staff personnel from specific areas related to the project. Even workers can be involved on the project team if their jobs are a function of the project activity. For example, a project team for the construction of a new loading dock facility at a plant might logically include truck drivers; forklift operators; dock workers; and staff personnel and managers from purchasing, shipping, receiving, and packaging; as well as engineers to assess vehicle flow, routes, and space considerations. Project teams are made up of individuals from various areas and departments within a company . Assignment to a project team is usually temporary and thus can have both positive and negative repercussions . The temporary loss of workers and staff from their permanent jobs can be disruptive for both the employees and the work area. An employee must sometimes "serve two masters," in a sense, reporting to both the project manager and a regular supervisor. Alternatively, because projects are usually "exciting," they provide an opportunity to do work that is new and innovative, and the employee may be reluctant to report back to a more mundane, regular job after the project is completed. The most important member of a project team is the project manager . The job of managing a project is subject to a great deal of uncertainty and the distinct possibility of failure. Because each project is unique and usually has not been attempted previously, the outcome is not as certain as the outcome of an ongoing process would be. A degree of security is attained in the supervision of a continuing process that is not present in project management. The project team members are often from diverse areas of the organization and possess different skills, which must be coordinated into a single, focused effort to successfully complete the project. In addition, the project is invariably subject to time and budgetary constraints that are not the same as normal work schedules and resource consumption in an ongoing process. Overall, there is usually more perceived and real pressure associated with project management than in a normal management position. However, there are potential rewards, including the ability to demonstrate one's management abilities in a difficult situation, the challenge of working on a unique project, and the excitement of doing something new. The project manager is often under great pressure . Scope StatementA scope statement is a document that provides a common understanding of a project. It includes a justification for the project that describes what factors have created a need within the company for the project. It also includes an indication of what the expected results of the project will be and what will constitute project success. Further, the scope statement might include a list of the types of planning reports and documents that are part of the project management process. A scope statement includes a project justification and the expected results . A similar planning document is the statement of work (SOW) . In a large project, the SOW is often prepared for individual team members, groups, departments, subcontractors, and suppliers. This statement describes the work in sufficient detail so that the team member responsible for it knows what is required and whether he or she has sufficient resources to accomplish the work successfully and on time. For suppliers and subcontractors, it is often the basis for determining whether they can perform the work and for bidding on it. Some companies require that an SOW be part of an official contract with a supplier or subcontractor. Work Breakdown StructureThe work breakdown structure (WBS) is an organizational chart used for project planning. It organizes the work to be done on a project by breaking down the project into its major components , referred to as modules . These components are then subdivided into more detailed subcomponents, which are further broken down into activities, and, finally, into individual tasks. The end result is an organizational structure of the project made up of different levels, with the overall project at the top level and the individual tasks at the bottom. A WBS helps identify activities and determine individual tasks, project workloads, and the resources required. It also helps to identify the relationships between modules and activities and avoid unnecessary duplication of activities. A WBS provides the basis for developing and managing the project schedule, resources, and modifications. A work breakdown structure is an organization chart that break down the project into modules for planning . There is no specific model for a WBS, although it is most often in the form of a chart or a table. In general, there are two good ways to develop a WBS. One way is to start at the top and work your way down, asking, "What components constitute this level?" until the WBS is developed in sufficient detail. Another way is to brainstorm the entire project, writing down each item on a sticky note and then organizing the sticky notes into a WBS. The upper levels of the WBS tend to contain the summary activities, major components or functional areas involved in the project that indicate what is to be done. The lower levels tend to describe the detailed work activities of the project within the major components or modules. They typically indicate how things are done. Figure 8.2 shows a WBS for a project for installing a new computerized order processing system for a manufacturing company that links customers, the manufacturer, and the manufacturer's suppliers. The WBS is organized according to the three major project categories for the development of the system: hardware, software/system, and personnel. Within each of these categories, the major tasks and activities under those tasks are detailed. For example, under hardware, a major task is installation, and activities required in installation include area preparation, technical/engineering layouts and configurations, wiring, and electrical connections. Figure 8.2. Work breakdown structure for computer order-processing system project(This item is displayed on page 324 in the print version)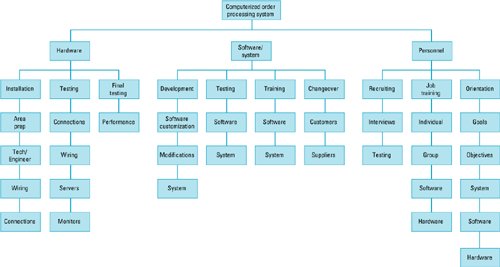 Responsibility Assignment MatrixAfter the WBS is developed, to organize the project work into smaller, manageable elements, the project manager assigns the work elements to organizational unitsdepartments, groups, individuals, or subcontractorsby using an organizational breakdown structure (OBS) . An OBS is a table or chart that shows which organizational units are responsible for work items. After the OBS is developed, the project manager can then develop a responsibility assignment matrix ( RAM ). A RAM shows who in the organization is responsible for doing the work in the project. Figure 8.3 shows a RAM for the "Hardware/Installation" category from the WBS for the computerized order-processing project shown in Figure 8.2. Notice that there are three levels of work assignments in the matrix, reflecting who is responsible for the work, who actually performs the work, and who performs support activities. As with the WBS, there are many different forms both the OBS and RAM can take, depending on the needs and preferences of the company, project team, and project manager. Figure 8.3. A responsibility assignment matrix
A responsibility assignment matrix is a table or chart that shows who is responsible for project work . Project SchedulingA project schedule evolves from the planning documents discussed previously. It is typically the most critical element in the project management process, especially during the implementation phase (i.e., the actual project work), and it is the source of most conflict and problems. One reason is that frequently the single most important criterion for the success of a project is that it be finished on time. If a stadium is supposed to be finished in time for the first game of the season and it's not, there will be a lot of angry ticket holders; if a school building is not completed by the time the school year starts, there will be a lot of angry parents; if a shopping mall is not completed on time, there will be a lot of angry tenants; if a new product is not completed by the scheduled launch date, millions of dollars can be lost; and if a new military weapon is not completed on time, it could affect national security. Also, time is a measure of progress that is very visible. It is an absolute with little flexibility; you can spend less money or use fewer people, but you cannot slow down or stop the passage of time.
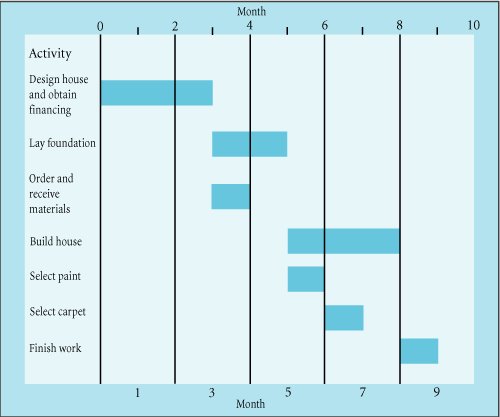
Developing a schedule encompasses four basic steps. First, define the activities that must be performed to complete the project; second, sequence the activities in the order in which they must be completed; third, estimate the time required to complete each activity; and fourth, develop the schedule based on the sequencing and time estimates of the activities. Because scheduling involves a quantifiable measure, time, there are several quantitative techniques available that can be used to develop a project schedule, including the Gantt chart and CPM/PERT networks. There are also various computer software packages that can be used to schedule projects, including the popular Microsoft Project. Later in this chapter we will discuss CPM/PERT and Microsoft Project in greater detail. For now, we will describe one of the oldest and most widely used scheduling techniques, the Gantt chart. The Gantt ChartUsing a Gantt chart is a traditional management technique for scheduling and planning small projects that have relatively few activities and precedence relationships. This scheduling technique (also called a bar chart ) was developed by Henry Gantt, a pioneer in the field of industrial engineering at the artillery ammunition shops of the Frankford Arsenal in 1914. The Gantt chart has been a popular project scheduling tool since its inception and is still widely used today. It is the direct precursor of the CPM/PERT technique, which we will discuss later. A Gantt chart is a graph or bar chart with a bar for each project activity that shows the passage of time . The Gantt chart is a graph with a bar representing time for each activity in the project being analyzed . Figure 8.4 illustrates a Gantt chart of a simplified project description for building a house. The project contains only seven general activities, such as designing the house, laying the foundation, ordering materials, and so forth. The first activity is "design house and obtain financing," and it requires 3 months to complete, shown by the bar from left to right across the chart. After the first activity is finished, the next two activities, "lay foundation" and "order and receive materials," can start simultaneously . This set of activities demonstrates how a precedence relationship works; the design of the house and the financing must precede the next two activities. Figure 8.4. A Gantt chart(This item is displayed on page 327 in the print version) The activity "lay foundation" requires 2 months to complete, so it will be finished, at the earliest, at the end of month 5. "Order and receive materials" requires 1 month to complete, and it could be finished after month 4. However, observe that it is possible to delay the start of this activity 1 month, until month 4. This delay would still enable the activity to be completed by the end of month 5, when the next activity, "build house," is scheduled to start. This extra time for the activity "order and receive materials" is called slack . Slack is the amount by which an activity can be delayed without delaying any of the activities that follow it or the project as a whole. The remainder of the Gantt chart is constructed in a similar manner, and the project is scheduled to be completed at the end of month 9. Slack is the amount of time an activity can be delayed without delaying the project. A Gantt chart provides a visual display of a project schedule, indicating when activities are scheduled to start and to finish and where extra time is available and activities can be delayed. A project manager can use a Gantt chart to monitor the progress of activities and see which ones are ahead of schedule and which ones are behind schedule. A Gantt chart also indicates the precedence relationships between activities; however, these relationships are not always easily discernible. This problem is one of the disadvantages of the Gantt chart method, and it limits the chart's use to smaller projects with relatively few activities. The CPM/PERT network technique, which we will talk about later, does not suffer this disadvantage . Project ControlProject control is the process of making sure a project progresses toward successful completion. It requires that the project be monitored and progress measured so that any deviations from the project plan, and particularly the project schedule, are minimized. If the project is found to be deviating from the plan (i.e., it is not on schedule, cost overruns are occurring, activity results are not as expected), corrective action must be taken. In the rest of this section we will describe several key elements of project control, including time and cost management and performance monitoring. Time management is the process of making sure a project schedule does not slip and that a project is on time. This requires monitoring of individual activity schedules and frequent updates. If the schedule is being delayed to an extent that jeopardizes the project success, it may be necessary for the project manager to shift resources to accelerate critical activities. Some activities may have slack time, so resources can be shifted from them to activities that are not on schedule. This is referred to as timecost trade-off . However, this can also push the project cost above the budget. In some cases it may be that the work needs to be corrected or made more efficient. In other cases, it may occur that original activity time estimates upon implementation prove to be unrealistic and the schedule must be changed, and the repercussions of such changes on project success must be evaluated. Cost management is often closely tied to time management because of the timecost trade-off occurrences mentioned previously. If the schedule is delayed, costs tend to go up in order to get the project back on schedule. Also, as a project progresses, some cost estimates may prove to be unrealistic or erroneous. Therefore, it may be necessary to revise cost estimates and develop budget updates. If cost overruns are excessive, corrective actions must be taken.
Performance management is the process of monitoring a project and developing timed (i.e., daily, weekly, monthly) status reports to make sure that goals are being met and the plan is being followed. It compares planned target dates for events, milestones, and work completion with dates actually achieved to determine whether the project is on schedule or behind schedule. Key measures of performance include deviation from the schedule, resource usage, and cost overruns. The project manager and individuals and organizational units with performance responsibility develop these status reports. Earned value analysis (EVA) is a specific system for performance management. Activities "earn value" as they are completed. EVA is a recognized standard procedure for numerically measuring a project's progress, forecasting its completion date and final cost, and providing measures of schedule and budget variation as activities are completed. For example, an EVA metric such as schedule variance compares the work performed during a time period with the work that was scheduled to be performed; a negative variance means the project is behind schedule. Cost variance is the budgeted cost of work performed minus the actual cost of the work; a negative variance means the project is over budget. EVA works best when it is used in conjunction with a WBS that compartmentalizes project work into small packages that are easier to measure. The drawbacks of EVA are that it is sometimes difficult to measure work progress, and the time required for data measurement can be considerable. | ||||||||||||||||||||||||||||||||||||||||||||||||||||||||

EAN: 2147483647
Pages: 358
- Assessing Business-IT Alignment Maturity
- Measuring and Managing E-Business Initiatives Through the Balanced Scorecard
- A View on Knowledge Management: Utilizing a Balanced Scorecard Methodology for Analyzing Knowledge Metrics
- Technical Issues Related to IT Governance Tactics: Product Metrics, Measurements and Process Control
- Managing IT Functions