Crosstab Queries
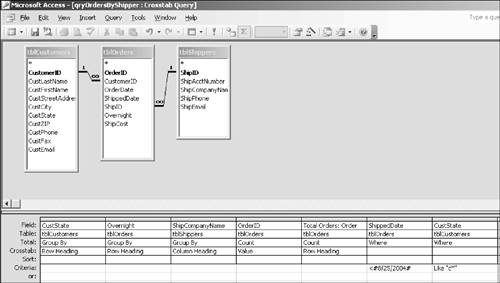
| Take almost any subject: sports, finance, politics. The professionals who make their money analyzing what goes on are always talking about "breaking down the numbers." Traffic accidents in Pleasantville totaled 72 last month; how many occurred east of Main Street, and how many west of Main Street? The freshman class at Ivy University has 1,784 students; how many come from each country? Total employees at Acme Widget number 3,587; how many are in each of the Production, Marketing, and Financial divisions? Often you'll want to find and compare breakdowns among different items in a single group. For example, you might want to see the country-by-country totals for the freshman class at each of the Ivy League schools. This is the kind of information delivered by the crosstab query, a type of totals query that summarizes data by tabulating it across the values of two fields (thus the term crosstab, short for "cross tabulation"). As with other totals queries, row headings are actual values. Unlike other totals queries, however, column headings in a crosstab query are also values rather than field names and totals. You'll soon see how this arrangement provides a matrix that generates totals where the two values intersect. You can create a crosstab query from scratch or by using the Crosstab Query Wizard in the New Query dialog box. But the wizard has its downside: You can use only one table. In any case, as with the Find Unmatched Query Wizard, it pays to understand how the wizard works so you can work with it and modify it when necessary. When you create a crosstab query from scratch, the wizard becomes self-explanatory. TIP You can use a workaround for the one-table limitation of the Crosstab Query Wizard. You can create a multitable query and then use the query as the basis for the wizard. But in that case, it might be just as easy to create a crosstab query from scratch. OverviewLet's briefly examine the steps required for creating a crosstab query before you actually make one. You start a crosstab query like any other: You create a new query in Design view and add the tables that have the data you need to the Design window. When you choose Query, Crosstab Query, you'll see two new rows in the design grid: Total and Crosstab. A crosstab query has three key elements:
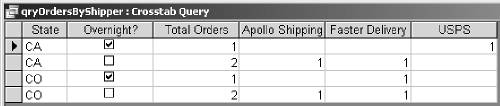
You can also add criteria. First add the field that will further define the records retrieved. Set the Total row to Where and keep the Crosstab row empty. Type your expression in the Criteria row. Creating a Crosstab QuerySuppose you're a Nifty Lions owner. You want to see how many orders each of your shippers is handling, broken down by state. You can use a crosstab query to view this information. What data do you need? The Orders table has OrderIDs. The Shippers table has the names of shippers. And the Customers table has a field for the customer's state. If you count OrderIDs, you can find the number of orders each shipper handled by state.
Additional Row HeadingsYou can add more row headings to break down the values further. For example, suppose that for each state you'd like to see a further breakdown between regular and overnight orders. Here's how to add the necessary column:
Add a Total ColumnYou might want to add a column that shows the total orders for each state. Let's name this column Total Orders. Here are the steps:
Add CriteriaYou can also add criteria to count only certain records. Here are some examples: Include Only Orders Before a Certain DateNote that the total orders for Iowa is 5 and for Pennsylvania is 3.
Include Only Orders for Certain StatesYou can also limit orders to those from certain states.
Include Only Orders for Certain States Before a Certain DateNow you'll include criteria for both the state and date.
|

EAN: 2147483647
Pages: 169
- ERP System Acquisition: A Process Model and Results From an Austrian Survey
- The Second Wave ERP Market: An Australian Viewpoint
- Healthcare Information: From Administrative to Practice Databases
- A Hybrid Clustering Technique to Improve Patient Data Quality
- Development of Interactive Web Sites to Enhance Police/Community Relations