6.1 The Simple Command Approach
6.1.1 Adding Color with the Color Command
Recent changes in the AutoCAD program have increased the colors available to CAD operators from 256 to 16 million! As was often heard back in the sixties “ oh wow! The colors the colors!
Changing the color in which you draw can be as simple as typing:
Command: -color
Enter default object color [Truecolor/ COlorbook] <BYLAYER>: [enter a color name or AutoCAD Color Index (ACI) number]
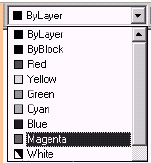
Of course, if you don't like to type, you can select the down arrow in the Color Control box (Figure 6.1.1a) on the Properties toolbar, and then select your color. Here you'll find the nine basic options including the seven basic colors AutoCAD provides. The other two are ByLayer , which assigns colors according to the layer setting (more on this in Section 6.2), and ByBlock . ByBlock means that objects will be drawn in basic black or white (depending on your background color). They will keep this color until joined together as a block (more on blocks in Chapter 18). When inserted as part of the block, they'll adopt the current color setting in the drawing.
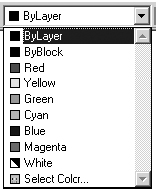
Figure 6.1.1a:
You may notice that White has a white/black color assignment in the Color Control box. The results of using this setting will depend on the background color you've set for the graphics area of your screen.
If you need more colors from which to choose, select the Other option. Alternately, you can type Color (or Col ) at the command prompt and bypass the Properties toolbar and command line prompts altogether. AutoCAD will prompt you with the Select Color dialog box (Figure 6.1.1b). This box “ newly revised for the '04 release “ has three tabs that we need to examine more closely.
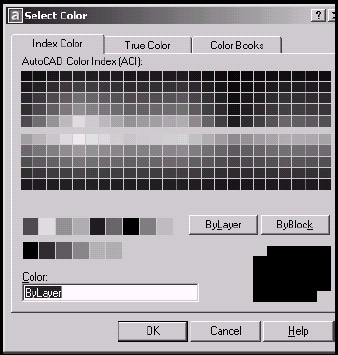
Figure 6.1.1b:
-
The first tab “ Index Color “ provides the traditional AutoCAD Color Index (ACI) interface. This interface provides 255 colors, shades of black and white, and the ByLayer / ByBlock settings we've already discussed.
To select a color from the Index Color tab, simply double-click on the desired color from the palette. AutoCAD puts a number in the Color text box that corresponds to that color (thank goodness you don't have to remember the names of 255 colors!). You can, of course, type in the number yourself if you know it.
-
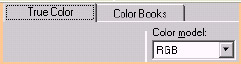
The second tab “ True Color “ allows color settings using 24-bit true color. Okay, that's computer-eze; what's it mean? Put simply, it means that you have up to 16 million colors from which to choose.
You have two color models from which you can choose on the True Color tab “ Hue, Saturation, Luminance ( HSL ) or Red, Green, Blue ( RGB ). Let's take a look at these.
-
Color can be manipulated by virtue of small changes in three qualities of color “ Hue, Saturation, or Luminance “ HSL settings (Figure 6.1.1c). Although these qualities will no doubt be familiar to those with art backgrounds, they won't be of much use to the average CAD operator. Still, a brief discussion is in order.
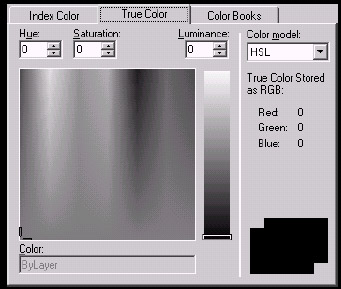
Figure 6.1.1c:
-
-
Hue is a measure of the dominant wavelength of light. To change the hue of your color setting, move the hue box (your cursor) from side to side over the color spectrum area of the tab. Alternately, you can change the number in the Hue control box from 0 to 360.
-
Saturation refers to the purity of a color “ that's, the lack of white pollution in the color or how vivid the color appears. To change the saturation of your color setting, move the hue box up and down over the color spectrum area of the tab. Alternately, you can change the number in the Saturation control box from 0 to 100.
-
Luminance refers to how the color reflects light. A value of 0 means that it doesn't reflect light (becomes black); a value of 100 means that it reflects all light (becomes white). The optimal value is 50. To change the luminance, adjust the color slider bar located at the right of the hue box. Alternately, you can enter a value in the Luminance control box.
-
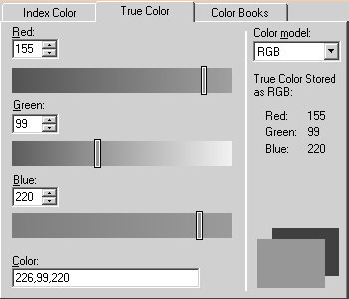
A more practical and (I think) more easily understood method of adjusting true color would be the RGB method (Figure 6.1.1d).
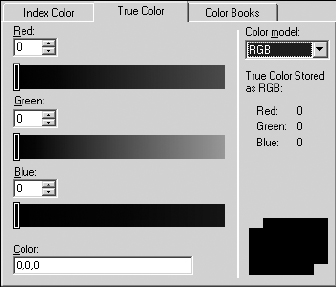
Figure 6.1.1d:You can create any color by mixing different amounts of red, green, and blue (just ask the guy who mixes your paint down at Home Depot). That's what you'll do on the True Color tab when you select RGB in the Color model list box. You can use the slider bars or fill in values (from 0 to 255) in the list boxes. Alternately, you can enter a color by entering a series of three numbers (each from 0 to 255) in the Color text box.
-
-
Color Books (the final tab “ Figure 6.1.1e) provide an interesting new addition to AutoCAD capability. This one may come in handy for the architect or interior designer.
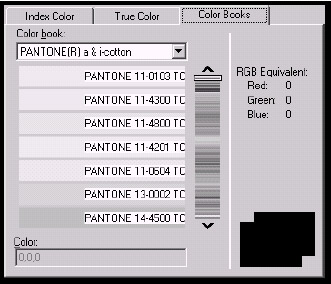
Figure 6.1.1e:Certain companies “ by default Pantone and RAL (a Germany-based company) “ provide color books. These tools are similar to those color cards you use at the paint store to decide what color to paint your kitchen. You select which book to use from the Color book list box, and then adjusts the color bar (to the right of the selection box) to locate a general color. When a general color has been selected, you then select a specific color (or shade of color) from the selection box.
Once the color has been selected, it appears in the Color Control box on the Properties toolbar. This way, you can increase the number of colors and shades of color immediately available for drawing.
Okay, let's try to draw some lines and circles in color!
| Note | In addition to the command line and toolbar, you can access the Color command by selection Color from the Format pull-down menu. |
Do This: 6.1.1.1 Drawing in Color
-
Start a new drawing from scratch.
-
Follow these steps.
Tools
Command Sequence
Steps
No Button Available
Command: -color
Enter default object color [Truecolor/ COlorbook] <BYLAYER>: yellow
1. Set Yellow as the current color using the keyboard method. Notice that yellow shows as the current color in the Color Control box (Figure 6.1.1.1.1a) on the Properties toolbar.
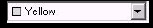
Figure 6.1.1.1.1a:
Command: c
CIRCLE Specify center point for circle or [3P/2P/Ttr (tan tan radius)]: 4,3
Specify radius of circle or [Diameter]: 1.5
2. Draw a circle with a 1 ½" radius at coordinates 4,3 . Notice the color.
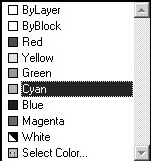
3. Set Cyan as the current color using the Color Control box (shown) on the Properties toolbar. To do this, pick the down arrow next to the box, and then pick Cyan .

Command: pol
POLYGON Enter number of sides <4>: 5
Specify center of polygon or [Edge]: _cen of
Enter an option [Inscribed in circle/Circumscribed about circle] <I>: [enter]
Specify radius of circle: 1.5
4. Draw a five-sided polygon inscribed in the circle you just drew. Be sure to use the Center OSNAP.
Your drawing looks like Figure 6.1.1.1.4a.
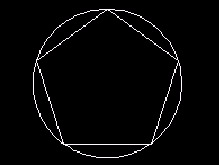
Figure 6.1.1.1.4a:Command: col
5. Call the Select Color dialog box by typing Color or col at the command prompt.
6. Set the color to number 30 by entering the number into the Color text box at the bottom of the dialog box, as shown.

7. Pick the OK button.


Command: os
Command: l
8. Set the running OSNAP to endpoint , and then draw lines connecting the corners of the polygon to form a star. Your drawing looks like Figure 6.1.1.1.8a.

Figure 6.1.1.1.8a:Command: col
9. Now let's use the RGB method to set a new color. Call the Select Color dialog box.
10. Pick on the True Color tab, and select RGB from the Color model list box.
11. Enter the number 226 into the Red , 220 into the Blue , and 99 into the Green control boxes. Notice that the slider bars reposition themselves in accordance with what you have entered, and that the color indicator in the lower right corner changes to show you the color you have set.
12. Pick the OK button to conclude the procedure.
Command: dt
Current text style: "Standard" Text height: 0.2000
Specify start point of text or [Justify/ Style]: m
Specify middle point of text: _cen of
Specify height <0.2000>: 3/16
Specify rotation angle of text <0>: [enter]
Enter text: Star
Enter text: [enter]
13. Create the text shown in Figure 6.1.1.1.13a.
The text should be middle-justified
in the center of the circle.
Make it 3/16" high.

Figure 6.1.1.1.13a:
Command: save
14. Save your drawing as MyStar in the C:\Steps\Lesson06 folder.
6.1.2 Drawing with Linetypes
What would drafting be without linetypes? Boring! And builders would not be able to tell hidden lines from centerlines. I suppose we'd have some pretty interesting buildings out there (not to mention some OSHA nightmares).
Luckily, AutoCAD has continued all the traditional drafting tools “ and even added a few. But let's look at linetypes.
The command to bring up the Linetype Manager dialog box (Figure 6.1.2a) is, you guess it, Linetype , although Ltype will work as well. The hotkey for Linetype is Lt .
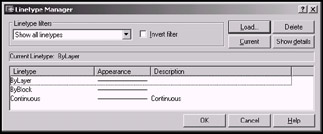
Figure 6.1.2a:
As you can see in the list box, there are only three options available by default. ByLayer and ByBlock work in the same way they did with the Color command. The only other option is Continuous , which provides a solid line. To select one of the options, simply pick on the desired linetype, pick the Current button, and then pick the OK button. You'll notice that the Linetype Control box on the Properties toolbar shows your choice as current.
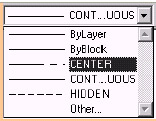
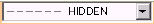
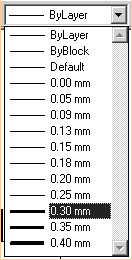
An easier way of setting a loaded linetype to current is simply to pick the down arrow next to the Linetype Control box (Figure 6.1.2b) on the Properties toolbar, and select the linetype of your choice (much as you did with the Color Control box).
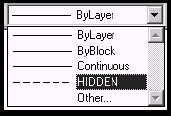
Figure 6.1.2b:
So what if the linetype I need isn't shown?
To avoid using a great deal of memory to hold information that may not be used, AutoCAD doesn't automatically load all the more than 45 available linetypes. But you can load them all or just the ones you want. We'll see how in our next exercise.
| Note | Why are there two commands to do the same thing? Well, in previous releases, Linetype delivered its options to the command line. This is still quite useful for Lisp programmers. You can still access the command line options by typing a dash in front of the command, as in -linetype . The command sequence to set a linetype looks like this:
You'll see that there are easier ways in the current release. The command line method is rarely useful; although by using this approach, you can set a linetype current without first loading it. (AutoCAD will load it automatically.) |
| Note | In addition to the command line and toolbar, you can access the Linetype command by selecting Linetype from the Format pull-down menu. |
Do This: 6.1.2.1 Drawing with Linetypes
-
Open va.dwg from the C:\Steps\Lesson06 folder. This is a valve attached to a vessel wall (Figure 6.1.2.1a). We'll add a centerline to the valve, and some hidden lines to indicate pipe inside the vessel.
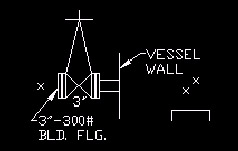
Figure 6.1.2.1a: -
Follow these steps.
Tools
Command Sequence
Steps
Command: lt
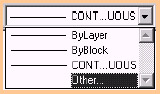
1. Open the Linetype Manager dialog box (Figure 6.1.2a) by typing Linetype , Ltype , or lt . Alternately, you can select Other in the Linetype Control box.
2. Pick the Load button. The Load or Reload Linetypes dialog box appears (Figure 6.1.2.1.2a).
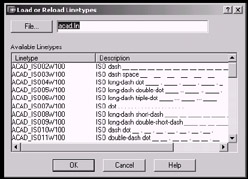
Figure 6.1.2.1.2a:3. Notice the File button at top. AutoCAD stores its linetype definitions in a file called acad.lin (although there is another file “ the acadiso.lin file used for metrics “ with additional definitions).
Notice also the list of linetype names under the Linetype heading in the list box. A description and sample appears to the right of each. Scroll down the list as necessary to find the linetype(s) you want to load.
For now, scroll down until you see Center . Select it by picking on the word Center .
Scroll down a bit more until you see Hidden . Holding down the Ctrl key on the keyboard (to enable you to select more than one linetype at a time) select Hidden .
4. Pick the OK button. AutoCAD closes the dialog box and lists Center and Hidden in the Linetype Manager, as indicated in Figure 6.1.2.1.4a.
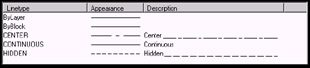
Figure 6.1.2.1.4a: 5. Pick the OK button to complete the command.
6. Set the current color to Magenta .
7. Now let's draw some lines. First, set Center as the current linetype. Pick the down arrow in the Linetype Control box on the Properties toolbar, and then select the Center linetype, as shown.
Command: l
8. Draw a line from the node at Point 1 to Point 2 (refer to Figure 6.1.2.1.9a). Notice that you have drawn a centerline.
Command: [enter]
9. Now draw a line from the handwheel “ Point 3 “ through the center of the valve to Point 4 (be sure to use the appropriate OSNAP and Ortho settings). Your drawing looks like Figure 6.1.2.1.9a.
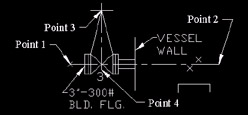
Figure 6.1.2.1.9a: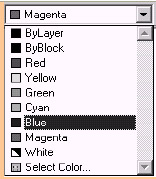
10. Set the current color to Blue .

11. Reset the linetype to Hidden .
Command: l
12. Now draw the hidden lines to show the pipe inside the vessel (refer to Figure 6.1.2.1.12a).
Start at the intersection (use OSNAPs) at Point 1 and draw to the node at Point 2 . Continue the line perpendicular to the basin below.
Repeat the Line command and draw a line from Point 3 to Point 4 and down to the basic.
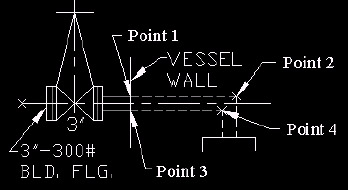
Figure 6.1.2.1.12a:
Command: qsave
13. Save the drawing, but don't exit.
You've seen that drawing with linetypes is fairly simple. But there are some other considerations of which you must be aware. The first of these is a system variable called LTScale .
AutoCAD defines dashed and dotted lines by a code that details how long to make each dash and each space. A use can define his own lines by learning that code “ but that's a topic for a customization guide. At this level, you must know how to adjust the line definitions (much as you learned to adjust the text size ) to appear as dashes or dots on a larger drawing. Otherwise, a dashed line defined as having ¼" dashes separated with 1/8" spaces may appear as a solid line on a scaled drawing.
Try the LTScale command now. You'll see that it has already been set to 8 (the normal default is 1 ). I set it here so you could see the hidden and centerlines as you drew them. Set it back to 1 and note the change to your drawing. Here is the command sequence.
Command: ltscale
Enter new linetype scale factor <8.0000>: 1
Your drawing will look like Figure 6.1.2c “ with dashes and spaces too tiny to see.
The best setting for the LTScale is the scale factor for the drawing (use the Drawing Scales chart in Appendix A).
The LTScale command sets the universal linetype scale factor for the drawing. All lines defined with dashes and spaces are affected. You can, however, adjust the LTScale specifically to a single line or linetype if you find it necessary.
We can set the LTScale universally or specifically from the Details section of the Linetype Manager dialog box. Let's look at this now.
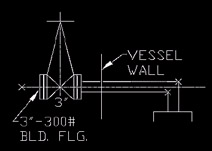
Figure 6.1.2c:
Do This: 6.1.2.2 Drawing with Linetypes
-
If you're not still in the va.dwg file, open it now. It's in the C:\Steps\Lesson06 folder.
-
Open the Linetype Manager.
-
Follow these steps.
Tools
Command Sequence
Steps

1. Pick on the Show details button to open the Details section at the bottom of the box. The Details section (Figure 6.1.2.2.1a) appears at the bottom of the dialog box.
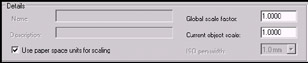
Figure 6.1.2.2.1a:2. Notice that the Global scale factor is currently set to 1.000 . Set it back to 8 (double- click in the text box next to the words: Global scale factor and then type 8 ).
3. Pick the OK button to return to the graphics screen. (If the drawing doesn't automatically regenerate, do so yourself by typing re at the command prompt.)
Notice that dashes reappear on the drawing.
Command: lt
4. Reopen the Linetype Manager dialog box.
5. Repeat Steps 2 and 3 to reset the Global scale factor to 1 . Notice that dashes again disappear from the drawing.

Command: e
6. Erase lines 1 and 2, as indicated in Figure 6.1.2.2.6a.
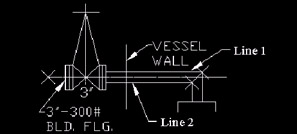
Figure 6.1.2.2.6a:Command: lt
7. Reopen the Linetype Manager.
8. Select the Hidden linetype from the list box. The word Hidden appears in the Name text box in the Details area. Now set the Current object scale to 8 (Figure 6.1.2.2.8a).
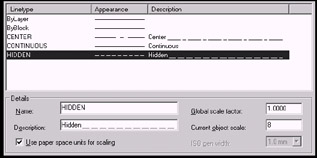
Figure 6.1.2.2.8a: 9. Pick the OK button to return to the screen.
10. Be sure Hidden is the current linetype (check the Linetype Control box on the Properties toolbar to be sure). Redraw lines 1 and 2 (Figure 6.1.2.2.6a).
Notice that the new lines appear dashed whereas other hidden lines don't (Figure 6.1.2.2.10a). All lines drawn will have an LTSCALE equal to the product of the Global scale factor and the Current object scale .
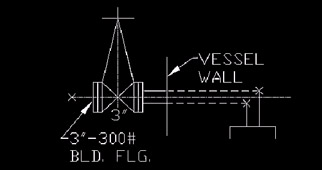
Figure 6.1.2.2.10a: Command: qsave
11. Save the drawing.
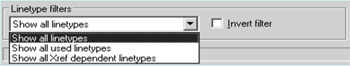
Note At the top of the Linetype Manager, you'll find a control box with the words Linetype filters above it (Figure 6.1.2d). Use these filters to help you determine the linetype status of the current drawing by controlling what AutoCAD shows in the Linetype Manager.
-
Show all linetypes refers to all the linetypes loaded into the drawing;
-
Show all used linetypes refers to only those linetypes currently in use;
-
Show all Xref dependent linetypes refers to linetypes dependent on their Xref status (more on Xrefs in Lesson 22).
You can, at the end of a project, choose to see all the unused linetypes so you can delete them (a good way to free some memory and reduce the drawing's size). Do this be selecting the Show all used linetypes option, and then placing a check in the Invert filters check box next to the control box.
-
6.1.3 Using Lineweights
| Note | Pixels are those little lights that make your monitor work. Think of them as tiny flashlights shining through colored lenses in the back of your monitor screen. The number of tiny flashlights depends on the resolution of your monitor (see your Windows manual). A standard resolution for AutoCAD would be 1024 x 768 “ or 1024 columns of tiny flashlights and 768 rows of tiny flashlights in every square inch of your screen! |
A fairly new addition to AutoCAD is the ability to add lineweight to all lines. Earlier releases allowed lineweight only on polylines or by plotter manipulation at print time, so be aware that material in this section won't be available if you work on releases other than 200x.
Exercise caution when using lineweights; they aren't true WYSIWYG objects “ that's, What You See Is (not necessarily ) What You Get. In Model Space, AutoCAD displays lineweight by using a relationship between pixels and lineweight. This enables you to tell that an object has weight “ even if you can't tell how much weight until he plots the drawing (or views it in Paper Space).
You can set lineweight as easily as he set color and linetypes. The command sequence is
Command: -lweight
Current lineweight: ByLayer
Enter default lineweight for new objects or [?]: [enter the desired lineweight “ AutoCAD will round your number to the nearest preset number available]
By now you should know that the dash in front of a command forces AutoCAD to use the command line because the command (without the dash) calls a dialog box. Let's take a look at the dialog box for Lineweight Settings (Figure 6.1.3a).
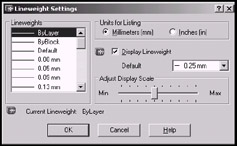
Figure 6.1.3a:
-
The Lineweights frame on the left provides a choice of predetermined lineweights from which to select “ from 0.00mm to 2.11mm (or 0.00" to 0.83" “ depending on the units selected).
-
The Units for Listing frame allows you to list the lineweight options in Inches or Millimeters. You can also set the units system variable at the command line by using the LWUnits command.
-
The check in the box next to the line: Display Lineweight in Model Space means that lineweights will be shown in Model Space. The weight will be determined in pixels (see the insert on the previous page). You can remove the check (or type Off at the prompt after the LWDisplay command) to prevent seeing lineweights.
-
The slider bar in the Adjust Display Scale frame allows you to control the pixels to lineweight ration. In other words, slide the bar to the left to minimize (or to the right to maximize) the number of pixels used to show lineweight.
Of course, the easiest way you can set the lineweight is just as you set the color or linetype “ using the Lineweight Control box on the Properties toolbar.
An interesting thing to note about the control boxes on the Properties toolbar “ you can also use them to change (as well as set) lineweight, color, and linetype!
Let's take a look at this.
Do This: 6.1.3.1 Changing the Lineweight
-
If you're not still in the va.dwg file, open it now. It's in the C:\Steps\Lesson06 folder.
-
Follow these steps.
Tools
Command Sequence
Steps
1. Without entering a command, select the vessel wall. Notice that three tiny squares appear and the line highlights. The squares are grips (more on grips in Lesson XX).
2. Pick the down arrow on the Lineweight Control box; then scroll down and select 0.30mm , as shown.
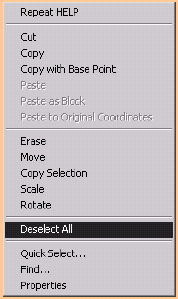
3. Right-click in the graphics area and select Deselect All from the cursor menu. This will clear the selection set on the screen. (Alternately, you can simply hit the ESC key on the keyboard.)
Notice the change in the line you selected. (Remember: you can use this technique to change linetypes, colors, and layers , as well!)
(Note: If you don't see the lineweight, toggle the LWT on the status bar On “ or down.)
Command: quit
4. Leave the drawing without saving it.