6.4. EXCEL CHARTS 6.4.1. Import Excel Charts THE ANNOYANCE: I can create charts in Excel, no problem. How in the world do I get them into PowerPoint? THE FIX: Copying the chart in Excel and using Edit  Paste Special in PowerPoint is probably the best way. This process gives you the widest variety of formats to choose from when pasting or linking your chart to the slide. Paste Special in PowerPoint is probably the best way. This process gives you the widest variety of formats to choose from when pasting or linking your chart to the slide. If you choose Microsoft Office Excel Object from the Paste Special list, your entire Excel workbook will be pasted into your PowerPoint presentation file. This option severs all ties to the original Excel file and enables you to work on the chart and its data directly in PowerPoint. If you've pasted your entire workbook into your presentation, you may want to right-click the chart and choose Grouping  Ungroup to remove the background data from the chart before finalizing the file or sending a copy to anyone. You cannot get the data back once youve ungrouped the chart, so you probably want to do this on a copy of the presentation file, not the actual working file. Ungroup to remove the background data from the chart before finalizing the file or sending a copy to anyone. You cannot get the data back once youve ungrouped the chart, so you probably want to do this on a copy of the presentation file, not the actual working file. Alternatively, in PowerPoint, you can select Insert Chart, click the cell in the upper-left corner of the datasheet, and choose Edit Import File. Navigate to the saved Excel file and click the Open button. In the Import Data Options dialog box, choose the appropriate chart or datasheet (see Figure 6-38). Figure 6-38. In an activated chart, select Edit Import File to import Excel data or charts into PowerPoints MSGraph. 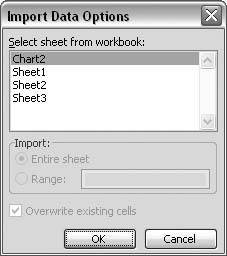
6.4.2. Pasted Charts Cause File Size Increase THE ANNOYANCE: I pasted a couple of charts from Excel into my PowerPoint presentation, and my PowerPoint file size ballooned! What happened? THE FIX: When you paste charts from Excel into PowerPoint, the entire workbook is pasted into the presentation by default. If you're pasting from a large Excel file, your PowerPoint file will get big, too. If this is an issue for you, you can choose from a few different options: Select Edit Paste Special and choose .wmf to paste a picture of the chart on your slide. It behaves like a picture, not a chart; it is completely divorced from the data used to create it. Double-click the "chart" on the slide to bring up a picture formatting dialog box. (In PowerPoint 2002 and 2003, you can choose this option from the Paste Options button when you do a plain ol' paste.) Select Edit Paste Special, choose the "Paste link option, and select Microsoft Office Excel Chart Object. This pastes a picture of the chart on your slide with a link to the original Excel workbook. Double-click the chart to open it in Excel, and any changes you make will actually be made to the Excel file. The thing you should know about linking is you must keep the Excel workbook available to the PowerPoint fileif you move the workbook, the link to the data will be severed, and the chart will act like a picture. Go ahead and paste the entire workbook. This allows you to work on the chart as usual inside PowerPoint, although it does increase the file size. When you're finished working on the chart and no longer need the data, select the chart and choose Draw Ungroup. This separates your chart from the data and knocks the file size back down to normal. The pieces of the chart will become individual objects on the slide.
6.4.3. Update Links Automatically THE ANNOYANCE: I linked some data from an Excel spreadsheet to my PowerPoint graph spreadsheet by copying the data in Excel and using Edit Paste Link on the graph datasheet. When I close the PowerPoint file and reopen it, the data links dont update. THE FIX: You can open each graph to update its link. Or you can use the free Chart Update add-in from Microsoft PowerPoint MVP Shyam Pillai (http://skp.mvps.org/download.htm). These links don't update because you've introduced MSGraph into the mix and MSGraph has to be activated before the links will update. You can eliminate this issue by creating and copying your charts in Excel. In PowerPoint, select Edit Paste Special, choose the Paste link option, and then choose Microsoft Office Excel Chart Object (see Figure 6-39). This removes MSGraph from the mix and relies solely on OLE links to Excel workbooks. Figure 6-39. If you choose the Paste link option, any updates to the data or chart must be made in the Excel file, not in PowerPoint. Be sure to keep your Excel and PowerPoint files in the same locations, or the link will break. Best practice is to place both files in the same folder before creating the link so you can easily move the folder to another computer without breaking the link. 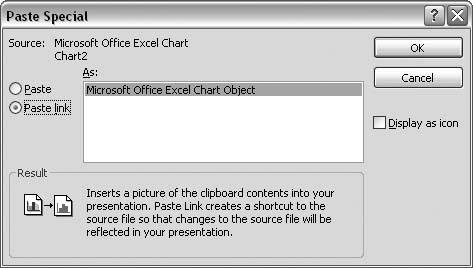
6.4.4. Prevent Linked Charts from Updating THE ANNOYANCE: I have a bunch of linked Excel charts in my presentation file. Every time I open the file, it spends forever updating the links. Is it possible to update the links when I wantlike just before I go get a cup of coffee? THE FIX: Select Edit Links to specify the link behavior for OLE linked objects (see Figure 6-40). Press the Shift or Ctrl key while clicking to select more than one linked object from the list, and then choose the Manual option. Figure 6-40. The Links dialog box lets you control the link behavior of OLE linked objects. 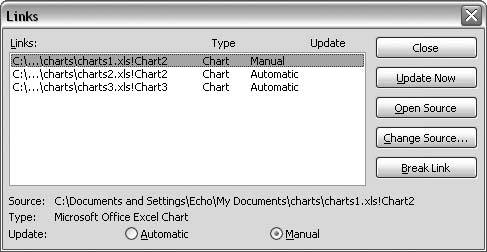
Note: Did you know the PowerPoint team at Microsoft doesn't "own" Microsoft Graph? The Excel team is actually responsible for it. Makes sense when you think about it, since Microsoft Graph is pretty much a calculation-free subset of Excel's graphing engine.
| How to Animate a Chart | To animate a chart in PowerPoint 2002 or 2003, add an animation to the chart, click the animation in the task pane, and choose Effect Options. On the Chart Animation tab, choose "By series" or "By category" from the "Group chart" drop-down list. (See Chapter 7 for more information on animations.) In PowerPoint 97 and 2000, select Slide Show Custom Animation and click the Chart Effects tab. Next, choose your animation and select an option from the "Introduce chart elements drop-down menu. In all versions, if the only option is to group the chart "as one object," apply a less complicated animationlike a wipe or appearto the chart. The level of grouping available depends on a combination of the type of chart and the actual animation effect used. |
|