| After you have developed or are in the process of developing policy to be deployed within your architecture, you will undoubtedly need to tune various rules to function securely without impacting your production applications and work flow. Any product that controls the endpoint interaction from "bad" behavior will have a tuning process and timeframe associated with it. There are many reasons why you must tune policy rules to your environment, including the following: Custom applications contain inappropriate behaviors It is not uncommon to discover applications within your environment that might cause buffer overflows throughout their operation. However, inhibiting buffer overflows might prevent such applications from functioning. Although the desired course of action should be to reprogram the software to function in a more appropriate, secure, and stable manner, your implementation timeline or internal programming resources might require you to move forward with a rule set that allows this normally undesirable action for these specific applications. With tuning, you can accomplish this granular exception. Restrictive rules might prevent required interaction While writing policies for deployment in your environment, you might discover that certain restrictive rules, such as file access control or network access control rules, prevent required applications or systems from functioning or having the availability required. Location of previously unknown applications It is common to discover applications installed across your systems that were not previously tested or allowed by your applications standards team. Although many of these applications are undesired and should be blocked, you might find some applications that are now required by certain departments and are part of everyday business use. These applications require tuning to function because they were most likely not tested during the lab and pilot portions of the roll out. A new application is installed As your environment evolves, new applications or upgrades to current applications will occur. These changes might require tuning deployed policy to allow appropriate functionality. This process should most likely occur as a step within your written application testing guidelines document and should never impact a production system.
All of the preceding occurrences will happen within most environments. Tuning is the process by which you can make exceptions to these and other behaviors that you want to prevent. Tuning also provides a mechanism to slightly modify rules so that they do not log the event but continue to prevent or control the interaction as initially desired. The next sections explain the tuning process and tools you can use to assist in the tuning process to efficiently complete this task. NOTE Just as you are required to tune your network Intrusion Detection System (IDS) and Intrusion Protection System (IPS) appliances, you must tune your CSA agents to eliminate the reporting or blocking of false positives.
Review of Key Features Impacting the Tuning Process You need to be familiar with several CSA MC features and concepts when tuning agent systems. Many of these features have been covered already throughout this book, including the following: Verbose versus standard logging When configuring rules, you almost always have the ability to set the log parameter for that specific rule. The log setting determines whether the matching action triggers an event to be added to the central CSA MC event log database. If the log parameter is set, events are sent to the CSA MC as they occur, but repeated events are grouped and sent only once per hour to eliminate flooding the event log. Verbose logging set at the group level causes all events to be sent to the event log, which can prove useful, particularly when combined with Test Mode, to assist in tuning policy as events occur rather than waiting for repeated actions to be sent to the central console. Event sets Event sets provide a mechanism to filter the event log or Event Monitor so that only the desired events display to the administrator tuning the policy. Event sets can be very granular, enabling you to view only the specific rule- or host-related events and isolate a specific issue. Test Mode Test Mode is the mechanism that removes the enforcement nature of rules to allow logging information of what would have been prevented without actually preventing actions. New agent deployments or new rule module deployments are typically performed initially in Test Mode. Test Mode enables you to watch and tune policy without impacting the usability of your customer applications and interaction, which enables you to observe both normal and abnormal behavior in a typical work setting instead of attempting to script interaction that might not be quite as accurate. Reports The various reports provided by the CSA MC can aid in the collection of data that will be necessary in tuning policy. You can also run reports to provide an offline paper copy of events that are occurring so that the workload required in tuning can be divided among the available resources as necessary. Agent polling and UDP hint messages Agents must request updates to receive newly tuned policy. This request occurs at regularly scheduled intervals called the polling interval. This parameter determines how often a system checks back in with the CSA MC for new policy or software updates. When tuning policy, you will make changes to rules that need to be redeployed to perform further testing. These rules will not be deployed unless the system manually requests a fast poll or the next polling interval occurs. You might need to shorten the poll interval for systems you are tuning to get desired policy on the endpoint in a timely manner. An additional feature added in CSA 4.5 is the concept of UDP hint messages. This feature can alert a system that a new policy update is ready and that the system should pull the update immediately. This feature greatly improves your ability to tune policy in an efficient manner. Note The polling interval is an important timeframe to understand because it can impact your management console if inappropriately timed. Too many systems polling at a time can cause CSA MC performance degradation. Also, you cannot generate rules if the number of agents polling per second is greater than 100. You are warned of this limitation when the number of agents polling per second is between 15 and 100.
Analysis Analysis is a new feature in CSA 4.5 that enables you to learn which applications are installed and which processes run on remote agent-protected systems. This feature enables you to interrogate specific processes to determine the nature of their interaction on the remote system. When tuning an application, it might prove beneficial to perform an analysis to see which systems have the application installed as well as what a specific application is attempting to do on the end system (which might be something required or possibly undesired).
Actively Tuning by Example You can tune policy in an environment using many methods and screens on the CSA MC. To illustrate some of the methods, this section covers a few of the common events that require tuning. Covering tuning for every type of event you might encounter in a deployment environment is impossible, so it is more important to understand the steps and required processes that you can apply to tuning any type of rule. The next sections examine some of the methods available and the processes you can use. Limiting the Event Log View Before tuning the policies in your environment, you must understand what you want to tune in order of priority. You might decide to tune a specific system that is running a unique policy, or you might decide to focus on tuning global events that impact many systems. To limit your view of events so that you can focus on that "needle in the haystack," you should use local temporary filters (Change Filter and Find Similar) available on the event screens and event sets. To filter the view from the event screens using either method, click the Change Filter link and apply the appropriate parameters. In Figure 12-14, you can see a configuration to filter events coming only from a specific host. Figure 12-14. Filtering Event View to Narrow Your Scope 
Tuning from Event Log Entries Below most event log entries, a few links enable you to tune the rule that caused the event. The Details link provides some information regarding the event that might assist in your decision to tune the event or accept it as a positive signature-based event. This detailed information enables you to see what policy, module, and rule caused the event, as well as to see granular parameters. The information included on the Detail Information screen that pops up as a result of clicking the link will vary based on the type of rule that triggered the event. The Rule # link displays the rule number that triggered the event and provides a clickable link that takes you directly to that rule. You can directly edit this rule from this view, but doing so could adversely affect the rest of your protected systems. It is important to understand that editing a global rule directly will impact any system running that rule. CAUTION Be cautious when editing rules directly. Editing rules directly will impact any other system using an edited rule in its combined rule set. So unless you are 100 percent sure that this action should be globally edited, be very careful. Instead of editing the rule directly, it might be wiser to clone the rule or rule module and edit the cloned rules rather than the rules that may be applied elsewhere.
To view which groups are using a specific rule, you can use the CSA MC search feature to search on the specific rule ID and then select groups from the reference list, as shown in Figure 12-15. The most common way to tune an event is to use the wizard feature in the event screens. Figure 12-15. Groups Impacted by a Rule 
Introducing the Event Management Wizard You can tune many events within the event log by using the Event Management Wizard. The wizard enables you to do the following: Tune the action of a rule that triggered an event Create an exception rule that allows the action to be granularly tied to a specific action or group subset Create an exception rule that prevents further logging of this rule Perform a behavior analysis of the process that triggered the rule to further interrogate the interaction
NOTE The wizard can only be used by events that were triggered by application control, buffer overflow, COM access control, file access control, network access control, registry access control, rootkit/kernel protection, and system API control rules.
Using the Event Management Wizard To open the wizard and use the features associated with it, click the Wizard link from the event that you want to tune. You then follow the prompts as follows: Step 1. | Read the available wizard options and choose as appropriate from the following. Alternatively, you can click Cancel if you do not want to take any of the listed actions, which are shown in Figure 12-16:
I know this is safe and I want to create and exception rule that will allow the action that triggered this event. I do not want to see further similar events and I want to create an exception rule that will stop logging similar events. I do not understand this event and I want to perform a behavior analysis that will target the process that triggered this event.
Figure 12-16. The Event Management Wizard 
| Step 2. | After you have chosen the appropriate option, click Next in the lower-right corner of the screen.
| Step 3. | If you choose the option to create an exception rule to allow the action, you proceed in the following order through the wizard:
- a. A screen displays that checks the rule for any state conditions that might be applied. If state conditions are tied to this rule, specify the appropriate condition.
- b. You are presented with the rule type and explanation, as seen in the Explain Rules view. You can also see information regarding the rule that was triggered. In Figure 12-17, you can see that you are tuning a registry access control rule and are therefore presented with the registry key that was accessed, the process that accessed the key, and the type of access attempted. When you understand the information displayed, click Next.
Figure 12-17. Event Management Wizard Step 3 Detail 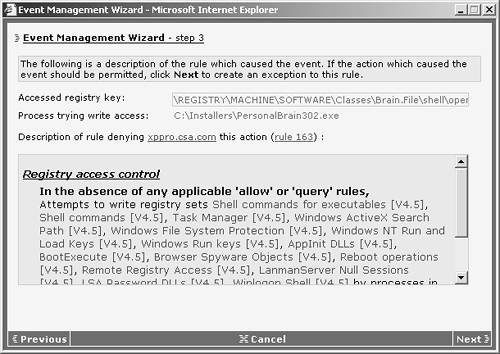
- c. You are now prompted to decide where you want to apply the exception rule you are creating. Your options are to create a new exception rule module that will be applied to certain groups, or add it to the specific module in which the original rule resides. The groups automatically selected by the wizard are related to the groups that the host that triggered the event belongs to. You can change these manually from this screen to include or exclude specific groups if the automatically selected list is not accurate as to what you are attempting to accomplish. Also, you should create a new exception rule rather than the alternative option, which could impact many more systems that might not require tuning.
- d. After choosing how to apply the change, you are shown the application class that will be created, which includes the process that caused the event. You can also choose already created application classes to include in the rule. To facilitate efficiencies associated with other rules that might require a reference to this process, an application class is created for this process instead of using a literal.
- e. A summary displays explaining the actions about to be taken in conjunction with the completion of this wizard process. After reviewing the summary, click Next to continue.
- f. As the final step in the wizard, the components are created and you are presented with the resulting rule. You might need to modify the rule to obtain a more general application. By default, specific parameters are used that you might find overly restrictive.
Note The wizard creates restrictive rules that you might want to generalize upon completion. For example, a network access control rule might be created after the wizard completes, but it will be defined with the specific source and destination IP addresses that triggered the event. Although you might want this, you might need to change those addresses to a more open network setting, such as 0.0.0.0-255.255.255.255, if the goal is to allow a protocol to function to all destinations rather than just to the specific destination that triggered the rule.
| Step 4. | If you choose the option to create an exception rule that will stop logging the event, you proceed in the following order through the wizard:
- a. The state condition information for the rule displays. Click Next to continue.
- b. You are then shown the type, number, and explanation. Click Next to continue.
- c. You are again presented with the option to add the Do Not Log rule to the rule module that is tied to certain groups or to edit the original module that contains the logging rule. Click Next to continue.
- d. A summary displays explaining the actions that will be taken upon completion of the wizard. Click Next to continue.
- e. Finally, you are presented with the rule created that will prevent logging for this rule. Click Next to continue.
Note To guarantee that the Do Not Log rule overrides the action-based rule that still needs to be maintained, the wizard creates the resulting rule with the Takes Precedence Over Similar Action rules set to maintain proper rule ordering.
| Step 5. | If you choose the Behavior Analysis option, the rule is checked to see whether any state conditions are applied so that you can focus your exception rule on an appropriate state. Click Next to continue through the wizard.
- a. As with any behavior analysis, choose whether to enable or disable policy enforcement mechanisms during the analysis, as shown in Figure 12-18.
Figure 12-18. Wizard-Initiated Behavior Analysis 
- b. Verify the process name that will be investigated as part of the analysis as well as the application class that will be used or created to identify the application to the analysis mechanisms on the agent system.
- c. You are given the option to enable verbose logging of the analysis job. This option is not event log related, but only specific to the information reported in the analysis itself. Specify when the job should end by choosing either After 15 Minutes, After 1 Hour, or After 24 Hours, as shown in Figure 12-19.
Figure 12-19. Tuning Analysis Parameters in the Wizard 
Note Remember that the analysis job will not start on the target system until the job is received as part of the normal polling process. If the system does not poll prior to the scheduled termination of the analysis job, it will not run. - d. You can now view the detailed summary of the analysis job you created. After doing so, click Finish to finalize its configuration.
- e. To conclude this specific branch of the wizard process, you can view the configuration of the analysis job and edit it as necessary.
| Step 6. | As the ultimate final step in most CSA MC processes, you must generate rules to deploy the configuration changes made in the database to the agent systems.
|
You can see how the wizard eases the tuning process by assisting in the creation of various rules and analysis jobs. Note that different rules have slightly different wizard options and components created as part of the process with regard to the event and rule types involved. Choosing Between the Event Log and Event Monitor Tuning will most likely be done in conjunction with viewing events in the event log or Event Monitor. The only difference between the two viewing options is that the Event Monitor provides an automatic refresh of the view at a set interval that you can customize by using the appropriate drop-down box. There is no right or wrong screen to use. You might have a personal preference as to which you like to use, and you should always use whatever is more comfortable for you to accomplish the tuning task at hand. As a general rule, most people prefer to use the event log to search for the next item to tune without being interrupted by a refreshing screen, and then once located and after tuning has begun, they switch to the Event Monitor to evaluate progress of the tuning. You can see whether any events are rolling into the database in near real time by using the Event Monitor after tuning a rule. Troubleshooting Tuning Occasionally, you might have an issue that you are attempting to troubleshoot that is not appearing in the event log. To force events to appear in the event log, even if the specific rule is not set to log, choose Log Deny Actions from the Rule Overrides section of the Group Configuration page. This option ensures that you receive all deny events (any of which could be preventing proper system interaction). NOTE Interestingly enough, the Log Deny Actions override only logs deny actions and not terminate process actions.
DMP and RTR Files DMP and RTR files are memory dump and request trace files, respectively. These files are located in the agent log directory. Cisco Technical Assistance Center (TAC) can interpret both of these files to assist in the troubleshooting of agent interaction and policy issues you might have. You might see events in an event log that say a process has been dumped. The event log identifies the specific location of the DMP file so that you can retrieve it for support staff to investigate. |