3.1 Poland s economic development and German - Polish business relations
3.1 Poland s economic development and German “Polish business relations
In the second half of the 1990s Poland, as one of the Central and Eastern European reform countries , developed into Germany s most important business partner. The following factors were most decisive :
-
Market size : with the purchasing power of almost 40 million inhabitants, Poland developed into the economic locomotive of Central and Eastern Europe during the second half of the 1990s.
-
Market proximity: the most important economic centres are situated no more than 600 kilometres from the German border.
-
Poland s dynamic economic development and positive market data during the 1990s.
Between 1994 and 1999 GDP grew at an annual rate of 4 “7 per cent (Figure 3.1). Despite the subsequent slowdown (with a rise of just 0.3 per cent, economic growth almost came to a standstill in the fourth quarter of 2001) Poland will, according to domestic and international analysts, be able to maintain itself in the medium term as a stable market and business location. The Polish government expects a noticeable improvement to take place in the economic development from 2003.
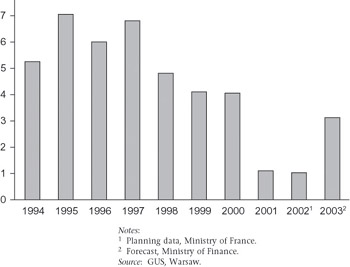
Figure 3.1: GDP development, Poland, 1994 “2003 (annual growth rate, per cent)
Notes: 1 Planning data, Ministry of France. 2 Forecast, Ministry of Finance. Source: GUS, Warsaw.
The fall in growth in 2001 was accompanied by a sharp drop in domestic demand, which for the first time since the beginning of the 1990s had become negative ( “2.0 per cent). Restrictive monetary policies, high unemployment and stagnating wages were key factors behind the economic slowdown. For the whole of 2001 a small reduction of 0.2 per cent occurred in industrial production.
The overvalued exchange rate for the zloty, high interest rates (which were holding back economic development) and the budget deficit turned into highly problematic issues. After several amendments were made to the law governing budget planning in 2001 the situation improved slightly in 2002. Given that there was a considerably lower deficit at the end of the first quarter in 2002 and an increase in total income of 2 per cent compared with the same period the year before, Polish analysts believe that a further adjustment of budgetary policies will not be necessary in 2002.
The unemployment rate “ a most critical indicator “ rose quickly from 13.1 per cent in 1999 to 18.1 per cent in March 2002. Whether the levelling off of the unemployment figures during February and March 2002 and other signs of hope in industrial production and retail turnover can be seen as signalling the end of the general downward trend cannot be answered definitely, but a comparison of the figures for the first quarter of 2002 with those for the last quarter of 2001 does not indicate an upward trend.
Another problematic area, the current account balance, was helped by an increase in exports in 2000 and 2001, the gap being reduced by high foreign direct investments. The overall GDP growth achieved in 2001, despite the downward trend, can be attributed to a 14 per cent rise in exports for the whole of the year and a simultaneous rise in imports by 2.7 per cent. However in the first two months of 2002 exports deteriorated notably in comparison with the previous year.
Germany was, as in previous years , Poland s most important trading partner in 2001. Until 2000 Poland was Germany s top trading partner in Central and Eastern Europe, but figures released by the Federal Office for Statistics show that the Czech Republic ousted Poland from that position in 2001 (Table 3.1). This was largely due to higher Czech exports, and Poland remained the region s most important market for German products.
At present almost 70 per cent of Polish exports go to the EU (Table 3.2). The second most important target region consists of the Central and East European (CEE) reform countries. In the ranking of individual export destinations Germany leads by far (34.4 per cent of Polish exports), followed by France and Italy (5.4 per cent each), Britain (5.0 per cent), the Netherlands (4.7 per cent) and the Czech Republic (4.0 per cent). Germany also leads the group of main exporting countries to Poland (Figure 3.2)
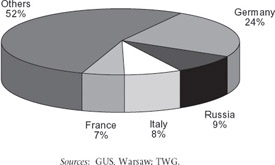
Figure 3.2: Sources of Poland s imports, 2001. Sources: GUS, Warsaw; TWG.
| Imports | Exports | Turnover | |
|---|---|---|---|
| Czech Republic | 28 380 640 | 29 215 842 | 57 596 482 |
| Poland | 26 409 938 | 29 783 089 | 56 193 027 |
| Source : Federal Office for Statistics, Germany. |
| Regions | Share of Polish exports |
|---|---|
| EU countries | 69.2 |
| Other industrial countries | 5.9 |
| CEE countries | 18.3 |
| Developing countries | 6.6 |
| Total Polish exports | 100 |
| Source : GUS, Warsaw. |
As a result of the worsening economic conditions in Poland and Germany the overall pace of foreign trade between them has slowed. Nonetheless, due to an increased export effort and a drastic fall in domestic demand Poland has been able to reduce its long standing trade deficit with Germany, which fell from DM5.1 billion (C=2.6 billion) in 2000 to C=1.87 billion in 2001.
On the German side, foreign trade with Poland is mainly conducted by the economically strong old federal states, with the new eastern states, including Berlin, being found at the lower end of the scale (Figure 3.3). The largest exporters to Poland, which are also the economically strongest regions of Germany, are North Rhine-Westphalia, Baden-Wuerttemberg and Bavaria. Brandenburg, however, gains first position when we compare the contribution of the various federal states to German GDP with their respective share in German “Polish trade. This reflects Brandenburg s close geographical proximity to Poland as well as positive developments in foreign trade with its eastern neighbour.
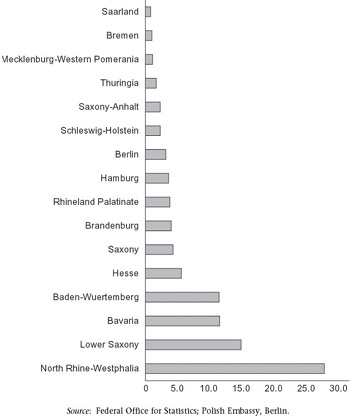
Figure 3.3: Germany s trade with Poland, by federal state, 2001 (percentage of total trade). Source: Federal Office for Statistics; Polish Embassy, Berlin.
Although Poland continues to be the top investment location in Central and Eastern Europe, unfavourable economic conditions in Poland and the rest of the world resulted in a marked slowdown in the influx of foreign investment in 2001. Nonetheless, after an increase of US$3.3 billion in the first six months, an increase of US$7.1 billion was achieved for that year, according to PAIZ (the state-owned agency for foreign investment). The projected figure for 2002 is of a similar magnitude.
By 1998 Germany had become the most important investor in Poland, in terms not only of the number of companies founded (which had been the case for sometime) but also of accumulated investment. However, from 2000 it lost its leading position and by the end of 2001 the most important investor was France (US$10 221 million), followed by the United States (US$7806 million) and Germany (US$7138 million) (Figure 3.4). The largest investing company, as of June 2001 was France Telecom, followed by Fiat, Daewoo and Citibank. The most important German investors were Bayerische Hypo- und Vereinsbank, Metro, Reemstma Cigarettenfabrik, Commerzbank, and Beiersdorf.
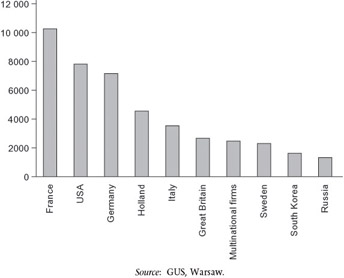
Figure 3.4: Accumulated foreign direct investment in Poland, by country (US $million). Source: GUS, Warsaw.
EAN: 2147483647
Pages: 121