Debugging Macros
You will occasionally make mistakes in your code. Many will be simple syntax or typing errors that are caught by the Visual Basic compiler. Most of the rest become obvious when you examine your code (the "duh" factor). Sometimes, however, you'll find a situation in which something is going wrong and you can't immediately figure out why. Your next step is to use the debugging tools available in the editor.
| Cross-References | For more information about debugging, including some concepts and general principles, see "Trapping Errors". |
Although most of the features discussed here are true debugging tools such as breakpoints, there are other features of the editor that are useful when debugging, but also have uses outside a debugging situation.
Using Breakpoints
A breakpoint is a place in your code where you want to temporarily break out of the run-time environment without actually ending your program, so that you can examine the code during execution. A breakpoint (and you can have as many as you want at one time) is a lot like a Pause button.
The F9 key toggles a breakpoint for the selected line of code, which is marked (using the default colors) by a brown dot in the margin and brown background for the line of code (see Figure 31-15). You can create breakpoints only in lines of executable code, which excludes blank lines, comments, and even lines where you declare a variable.
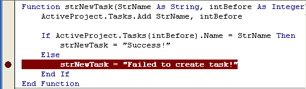
Figure 31-15: If a new task is successfully created in this function, this breakpoint never gets hit and execution proceeds normally.
| Note | Press Ctrl+Shift+F9 to clear all breakpoints from your code. |
Tracing Execution
After your program has been paused , you need to see what's going wrong with your code. This can mean watching your code run line by line ( tracing ) to see where, for example, it takes a different path through a decision structure than what you expected.
The following tools are available when tracing code:
-
The F8 key steps into a procedure, which is the most detailed mode of tracing. If the procedure you're tracing makes a call to another procedure, execution transfers to the called procedure just as it would normally, but in break mode.
-
After you've stepped into a procedure and have decided that you no longer need to trace through it, you can step out (Ctrl+Shift+F8) to return to the calling procedure.
-
Stepping over (Shift+F8) is to treat a call to another procedure as a stand-alone statement; that is, to trace the code that calls another procedure without actually tracing the code in the called procedure.
-
Using the Run To Cursor option (Ctrl+F8) essentially creates a temporary breakpoint. Code runs from the current location to the cursor, where it re-enters break mode. This is useful if you stepped into a procedure and want to skip over large sections of it without stepping out of it, but don't want to create an actual breakpoint.
Note Pressing F5 while tracing execution returns to normal execution, unless another breakpoint is encountered before the program ends.
Using Watches
Watches are used to keep track of values automatically while debugging. A watch is anything that can be evaluated to produce a value, which means it can be an expression such as ActiveProject.Tasks(intBefore).Name = strName, or simply the name of a function or variable (see Figure 31-16).
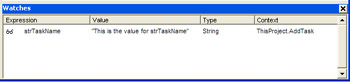
Figure 31-16: The Context column shows that the scope for the variable is local, existing in the AddTask procedure of the current module. If the active statement were in another procedure, the Value column would display <Out of context>.
| Note | Use Auto Data Tips as a watch The Auto Data Tips option (enabled by default) works like an ad hoc watch by providing information about the value of a variable (including the value of properties) when you move the mouse pointer over it while in break mode. |
You can use watches in two ways:
-
To simply watch the value of an expression while debugging.
-
To define a condition, rather than simply a line of code, that should force entry into break mode.
You can add watches while in design mode or break mode. Although you can manually enter the expression you want to watch in the Add Watch window (see Figure 31-17), it's easier to simply highlight the variable or expression by right-clicking in the Code window and then clicking Add Watch.
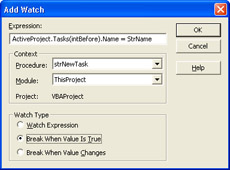
Figure 31-17: Set the Watch Type to specify whether you want to watch the expression or test its value to determine when to enter break mode.
Using the Locals Window
The Locals window acts like a dynamically generated list of watches for the current procedure. As execution moves from one procedure to another in break mode, the Locals window is updated to show a list of local variables and their values (see Figure 31-18).
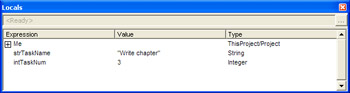
Figure 31-18: Click the plus sign (+) next to the expression "Me" to see the value of every property, variable, and function referenced by or defined in your project.
If a variable can be assigned a value in more than one location in a procedure (such as when a different value is assigned to the same variable, depending upon which path is taken through a decision structure), it is listed once for each possible assignment. Assuming that the procedure runs successfully, only one of these occurrences will have an entry in the Value column by the time execution moves out of the procedure.
Unlike the Watches window, which is read-only, you can modify items in the Value column to test different actions taken by your code. If you had a decision structure in your code, for example, that took different actions according to the value of a local variable, you could do the following:
-
Insert a breakpoint at the beginning of the structure and then run your macro.
-
When execution enters break mode, step through the decision structure to see the results.
-
At the end of the decision structure (or at any time before execution moves to a different procedure), change the value of the variable in the Locals window to something else.
-
Select the line with the breakpoint, use Ctrl+F9 to force execution to return to that line, and then step through the decision structure again.
Using the Immediate Window
The Immediate window (Ctrl+G), which can be used when debugging or at design-time, is a very versatile feature of the editor: Think of it as a "scratch pad" for code.
In design mode, you can enter a question mark (?) and any expression into the Immediate window to be evaluated. Typing ?8*7 and pressing Enter, for example, returns 56 just below the expression in the Immediate window. You can even enter small procedures to be evaluated, although they must be entered as one line, such as the following:
for x =1to 3: msgbox x: next x
In break mode, you can do anything you can in design mode, plus you can do the following:
-
Find the value of variables:
?strname
Tip When capitalization matters Capitalization in the Immediate window doesn't matter unless you have multiple variables with the same name but different capitalization.
-
Assign new values to any local, module-level, or global variable:
strname="some new value"
-
Evaluate expressions:
?ActiveProject.Tasks(intBefore).Name = strName
Note Edit and re-evaluate an expression You can edit an existing expression in the Immediate window and then press Enter to re-evaluate it, without having to type the expression anew.
Debugging with Navigation Tools
There are a few other features in the editor that, although frequently used while debugging, are actually tools for navigating within your code. They are most useful in modules that contain many procedures, in which finding a particular item can sometimes be difficult.
Bookmarks (see Figure 31-19) can be used to mark a location in your code. Unlike breakpoints, bookmarks can be used anywhere , including blank lines.
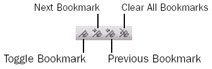
Figure 31-19: Use the bookmark controls on the Edit toolbar to toggle, move between, or delete all bookmarks.
The Definition command (press Shift+F2 or right-click the Code window) moves focus to the location where the procedure or variable under the mouse pointer is defined. If the item is a member of a type library referenced by your project and not defined in your code, focus moves to the appropriate location in the object browser.
The Last Position command (press Ctrl+Shift+F2 or right-click in the Code window) returns focus to the previous location after using the Definition command or changing code. The Last Position command loops through as many as eight locations.
EAN: 2147483647
Pages: 268