Overt Analysis
| | ||
| | ||
| | ||
Overt analysis is performed on a running system to obtain volatile information. Currently running processes and services, open documents and applications, inbound and outbound network connections, and the contents of memory are all transient data that may need to be acquired before system shutdown. Likewise, the acquisition of volatile information can be used as an initial triage (for example, to determine whether a worm infection is present) or to perform an investigation on a machine that cannot be taken offline.
There are three primary methods of overt analysis: using the Windows GUI, using a local command line, and using a remote command line. There are additional variations on each of these techniques as well.
GUI-based Overt Analysis
The most invasive (in terms of likelihood of altering information) analysis is to perform an analysis from the Windows GUI. This analysis entails using existing Windows management programs (for example, Regedit, the registry editor) or third-party graphical tools (for example, Sysinternals Process Explorer).
| Warning | All of the overt analysis techniques noted in this section rely on the system being unlocked. Unlocking by an administrator will change the user context. If the system is locked by a particular user, either that user 's password needs to be entered or the password reset centrally by an administrator to unlock the system. If the system cannot be unlocked, the techniques described in the covert analysis section may provide some information on the live environment. |
GUI tools provide an advantage over command line tools in that information can be viewed and retrieved interactively in a graphical fashion. Hierarchies as well as complex correlations can be presented in a more concise fashion with graphical tools, and the viewing of certain files (for example, images and movies) require the use of the GUI. While these are compelling reasons to utilize GUI tools in an overt analysis, there are several reasons to avoid GUI tools on a live system unless the specific situation dictates it:
-
GUI tools alter the system to a greater degree. The typical GUI tool utilizes more memory, which potentially overwrites evidence in RAM and in the cache, and calls more libraries for the generation of the GUI in addition to the collection of the data than the corresponding command line tool. This results in greater system alteration when using a graphical tool instead of an equivalent non-graphical tool.
-
GUI tools may be altered . Utilizing a built-in GUI tool on the target system has the same disadvantage of using any un-trusted binary. The tool itself may be altered. Although rootkits, which replace key binaries, are less frequently seen on Windows systems than on Unix, they do exist. If the binary has been replaced , the GUI tool used may intentionally hide the specific information you are looking for! Even if the binary for the tool is confirmed valid, any libraries dynamically linked to that tool may also be suspect.
-
Scripting is easier with non-graphical tools. Command line tools are built for scripting and used in batch files. By pre-scripting an analysis, the amount of time spent on a given system is minimized and the likelihood of accidental alteration reduced, providing another advantage for command line tools.
With the disadvantages given previously, there is still one primary use of the GUI in an overt analysis: viewing open applications from the taskbar. Information on what is open in terms of both applications and files from an end-user perspective, as opposed to from a background process, can be determined easily without touching the keyboard.
As the first step in overt analysis, the investigator may move the mouse (not click any buttons , just move the mouse) to disengage power saving mode or screensavers. A picture of the screen can then be obtained from a camera. After the initial screen picture is obtained, if evidence is suspected of being present in one of the applications shown in the task bar, each of those applications can be maximized and another picture taken of each.
| Warning | Full-screen captures can be done on Windows systems using the Print Screen key or ALT-Print Screen for just the selected window. This is not recommended, however, as the captured screen overwrites part of memory, changes the contents of the clipboard, and requires another program to paste into and then save. |
| |
Clever rootkits leave the binaries and replace the core files, including Dynamic Link Libraries or DLLs. If the core libraries are replaced, any third-party tools that take advantage of these libraries will also be affected. Static linking (including normally shared libraries in the executables) is used when a rootkit infection is suspected.
Although a best practice to avoid using on system DLLs, the number of Windows incidents involving DLL-level compromise remains small at the time of writing but is growing with the introduction of packages like Hacker Defender, FU, and Vanquish. Microsoft makes a detection tool for rootkits called Strider Ghostbuster, available from Microsoft Research, which can be used to scan systems if a rootkit installation is suspected.
| |
One final task that can be done easier from the GUI is viewing the contents of the clipboard. Windows uses the clipboard to store information for pasting. The contents of the clipboard or clipbook in later version of Windows can be viewed by selecting Program Files Accessories Clipboard Viewer on Windows 9 x /NT/ME or by selecting Start Run and typing Clipbrd in the text box on Windows 2000/2003/XP. For a better solution, a copy of the clip-brd.exe executable known to be good for the specific version of Windows being analyzed can be run from a secure CD or floppy disk. Figure 8-9 shows the results of viewing the clipboard on a system and reveals a screen capture still present.
Figure 8-9: Clipboard contents
| Tip | Later versions of Microsoft Office contain an even more robust clipboard, which can store up to 24 items at once. These can be viewed by selecting Edit Office Clipboard from the menu in any Office application, even if the contents were copied in a different application. |
Local Command Line Analysis
Analyzing a live system locally from the command line is the most common (and least impactful) form of live system analysis noted. Performing a command line analysis requires familiarity with the Windows command line options, a proven command interpreter, and copies of other command linebased programs that provide information in a more adaptable format than is available with the standard Windows commands.
| Tip | The Helix CD, in addition to providing an excellent bootable Linux forensics environment, already contains a trusted command shell as well as other Windows forensic response tools and the ISO can be modified to include any additional tools you frequently use. |
Command line analysis is best performed offline on a non-evidentiary system first, then performed on the target system. The steps for performing a local command line analysis of a running system are as follows :
-
Build a functionally identical system (with the same Windows version and as similar an environment as possible).
-
Acquire the necessary command line tools for the analysis as well as the command interpreter (cmd.exe) and place them on CD (or floppy is a CD is not accessible on the machine in question).
-
Attempt and record the individual commands needed to obtain the data from each specific tool.
-
Place the individual commands into a batch file, and then run the batch file and note the results.
-
Take a floppy or CD with the batch file to the live machine and run it.
-
Save the evidence generated to a networked using netcat (see the section "Remote Command Line Analysis" later in this chapter) or local storage location.
-
Generate an md5 hash of the stored evidence.
-
Burn the evidence to CD or other non-rewritable media.
| Warning | Microsoft includes two versions of its command interpreter in later Windows releases http://www.command.com and cmd.exe. The http://www.command.com interpreter is provided for backward compatibility and should not be used for forensic purposes (for example, by selecting Start Run and typing command in the text box) as it does not fully support key features such as long file names . Always use cmd.exe (for example, by selecting Start Run and typing cmd). |
The specific commands necessary for a basic live machine analysis are detailed in the individual sections that follow.
When receiving the output from a command line tool, the standard approach for forensics is to redirect to a file. Redirection from the command line is done using the greater-than sign (>). To redirect the output of the directory command to a file called output.txt, the following command line would be used:
C:\>dir > output.txt
This preceding command creates a new file called output.txt in the root directory of the C: drive. Another location for the output can be specified (for example, dir > a:\evidence\output.txt will create a file with the output of the command in the evidence directory of the A: drive).
Because the greater-than sign overwrites a file if it already exists, a better option is to use the append redirect, which consists of two greater-than signs (>>). The same command here using an append is as follows:
C:\>dir >> output.txt
By using the append characters , a new file is still created if one does not already exist, but any output from the command will be appended to the file if it does exist, preventing the accidental overwriting of existing evidence.
Depending on the size of the output, the evidence can be stored directly to a floppy disk. Alternatively, the evidence can be stored on a USB-attachable drive as well. Never store the evidence to any of the drives on the evidence machine. Doing so will overwrite potential evidence. Finally, the data can be sent over a network and stored to an external forensic machine (see the following section for details).
| Warning | Plugging in a USB drive (hard disk or flash drive) to a machine under investigation does involve the loading of drivers in the background and may alter information on existing drives in the registry. If using a USB-based drive, collect the registry data before connecting the USB device. |
Remote Command Line Analysis
A final alternative to performing a local command line analysis is to use a remote command line. A remote command line may be used in two ways: pulling from the forensic workstation or pushing to the forensic workstation. Both methods can be accomplished using a small, free tool called NetCat.
| Tip | If encryption is required (when the data is being transmitted over an unsecured network connection), a version of NetCat that uses encryption, CryptCat, can be used instead. CryptCat is available from http://www.farm9.org. |
Using the Pull method, a NetCat listener is started on the evidence machine. The listener opens a local command shell, which can then be used remotely to type the same commands as the local command shell. Instead of redirecting output to a file, however, the output can be captured in the connection logs and parsed out at a later point. The NetCat listener support connections from both NetCat itself as well as from standard Telnet clients . An excellent Telnet client for forensics (as well as an SSH client) is available in PuTTY and includes full logging capabilities.
To start a NetCat listener, the following command line can be used:
D:\forensic_tools>nc -L -p 23 -t -e cmd.exe
| Tip | The command line provided keeps the DOS window that it was started in open. To run NetCat in the background, the -d option can be used. |
The preceding command is run from the D: drive (in this case a CD-ROM containing known-good versions of both the NetCat program and the cmd.exe file in the forensic_tools directory), but could be run from a floppy as well. The -L option initiates a persistent listener ( -l initiates a single-use listener that terminates after a single connection) on the suspect's machine and waits for an incoming connection. To bind it to a port, the -p option is used with port number 23 (the standard Telnet port). This could be changed to any port number to hide the connection and/or tunnel through a firewall. The -t option indicates a Telnet negotiation should be engaged with the client, allowing standard Telnet clients to connect in addition to NetCat itself. Finally, the -e option binds the command prompt input and output to NetCat.
When the session has finished, typing exit from the remote machine will close the connection. Figure 8-10 shows the results of typing netstat from a remote command shell (PuTTY was used as the Telnet client).
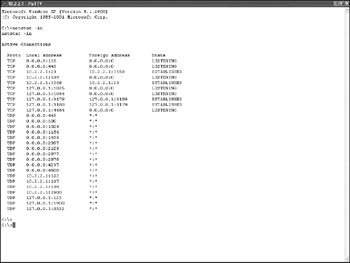
Figure 8-10: PuTTY connection to NetCat
| Note | PuTTY also has SFTP and SCP programs available for securely copying files. |
The more common Push method of using a remote command line requires that commands be run on the local command line but that their output be redirected to a remote shell. In this case, a NetCat listener is started on the box where the evidence will be stored using a persistent listener:
C:\evidence\nc -L -p 23 >> evidence.txt
| Tip | Use a non-persistent listener (the -l switch instead of -L) and change the file name before each command sent. This removes the need to later break apart the evidence file by command. |
The preceding command line starts a standard listener with the output directed to the file evidence.txt. Note the append characters are used. This is critical because NetCat will actually restart the listener after each command. If the append characters are not used, the file will be overwritten each time.
| Tip | When using PuTTY, don't use the -t switch for the NetCat listener and select Raw Mode for the connection type and Log All Session Output from the PuTTY connection screen. |
After the listener is started on the remote system, the commands are typed or the batch file run on the local system and the output redirected to NetCat using the pipe character (). The pipe character takes the output from one program and uses it as input to another program. To send output to the listener, the information is redirected as follows, typed on the suspect's machine:
C:\>fport nc 10.0.0.1 23
This command sends the output of the forensic tool fport to the NetCat listener at IP address 10.0.0.1 on port 23. There are problems with this method, however. It requires a break to be issued (Control-C) on the suspect's machine to let NetCat know the connection is over, requiring user interaction as well as advanced knowledge of when the program is actually complete. There are two solutions to this. The first is to use the timing option of NetCat, -w , which takes a given time in seconds before closing the connection. This relies on an approximation of how long the operation will take, for example, fport nc 10.0.0.1 23-w 5 will wait five seconds before automatically terminating the connection. The second is to write the code to a temporary file locally (on the A: drive or other removable media) and then to send it to NetCat, delete it, and move it to the next statement. This allows for safer batch file generation but requires no command to output more than the available space on a floppy drive. The chained commands would be as follows (instead of deleting, the next command can also just use a single greater-than sign to overwrite the last file):
C:\>fport > a:\evidence.txt C:\>type a:\evidence.txt nc 10.0.0.1 23 -w 5 C:\>del a:\evidence.txt
| Tip | Looking at the output file in a read-only viewer can give a good indication of when the program is complete. Windows ports of the Unix tail command are excellent for this task. |
Basic Information Gathering
Before any specific live system information can be obtained, most investigations will gather basic information about the system and enable the appropriate logging to ensure the accuracy and repeatability of the steps taken.
The first step in command line live system analysis is to enable local logging (if connecting via a remote command line, the logging feature of the relevant Telnet client can be used in place of or in addition to local logging). Unlike the built-in logging command on a Unix system, Windows logging of commands is limited to the command itself and any switches associated with the command. Output is not logged using the basic logging features but is logged with Telnet session logs.
The primary command for logging, which should be the first command in the batch file (or typed) during a live system analysis, is DOSKEY. DOSKEY enables all commands typed to be logged as discrete entries in the order they were entered and allows the use of the up arrow to recall commands. To enable DOSKEY, the name is typed from the command line:
C:\> DOSKEY
In addition to being the first command typed, DOSKEY is also the last command typed in a live analysis, along with the /HISTORY switch to display all of the command entered during the session. The sample output of DOSKEY /HISTORY from a forensic session is as follows:
C:\>DOSKEY /HISTORY date /t nc www.chadsteel.com 23 time /t nc www.chadsteel.com 23 cd Tools dir net session nc www.chadsteel.com 23 fport nc www.chadsteel.com 23 dir > output.txt type output.txt nc www.chadsteel.com 23 DOSKEY /HISTORY C:\>
The second and third commands typed are generally the same as well. They establish the date and time the investigation was performed. The date and time need to be recorded both electronically and offline. The electronic time should be added to the output file using the date and time commands:
C:> DATE /T >> A:\Evidence.txt C:> TIME /T >> A:\Evidence.txt
| Tip | Have the second command be an ECHO command in the batch file which labels the evidence file with details such as the examiner name and location. |
The /T switch prints out the date and time. By default, the DATE and TIME commands are interactive and allow the changing of the local DATE and TIME as well. As soon as the date and time are recorded electronically, the date and time should also be read from a known-good time source. Cell phones are generally a reasonable quick solution. The difference is noted in the log book.
When the date and time are established and logging has started, specific details about system components can be gathered. The PsInfo tool from SysInternals is the first stop in gathering basic system information. PsInfo provides information on the operating system, hardware, and software installed on the system. The PsInfo tool is used with the -h , -s , and -d switches to return the list of installed hotfixes (for proving that the system was inoculated and refuting a "worm did it" defense), a list of installed software, and information on the system volumes respectively. The information generated is gathered from the HKLM\SYSTEM registry key. Sample output of PsInfo (truncated) is as follows:
C:\>PsInfo -h -s -d PsInfo v1.63 - Local and remote system information viewer Copyright (C) 2001-2004 Mark Russinovich Sysinternals - www.sysinternals.com System information for \CMSSWEB: Uptime: 23 days 12 hours 37 minutes 10 seconds Kernel version: Microsoft Windows Server 2003, Uniprocessor Free Product type: Standard Edition Product version: 5.2 Service pack: 0 Kernel build number: 3790 Registered organization: Personal Registered owner: Chad M.S. Steel Install date: 8/5/2003, 6:09:29 PM Activation status: Activated IE version: 6.0000 System root: C:\WINDOWS Processors: 1 Processor speed: 865 MHz Processor type: Intel Pentium III Physical memory: 510 MB Video driver: Intel(R) 82815 Graphics Controller (Microsoft Corporation) Volume Type Format Label Size Free Free A: Removable 0% C: Fixed NTFS 11.7 GB 7.9 GB 68% D: CD-ROM 0% E: Fixed NTFS 19.5 GB 19.5 GB 99% F: Fixed NTFS 9.8 GB 9.5 GB 97% G: Fixed NTFS 9.8 GB 6.0 GB 61% H: Fixed NTFS 61.0 GB 9.5 GB 16% OS Hot Fix Installed KB282010 8/6/2003 KB818529 8/5/2003 KB819696 8/5/2003 Q819639 8/5/2003 Q828026 10/4/2003 Applications: Adobe Reader 6.0 6.0 DirectX 9 Hotfix - KB839643 Diskeeper Server Enterprise Edition 8.0.459 Dynamic DNS Client .NET Edition - Service 1.1.0 Ethereal 0.10.7 0.10.7 Google Toolbar for Internet Explorer LiveUpdate 1.80 (Symantec Corporation) 1.80.19.0 Microsoft Data Access Components KB870669 Mozilla Firefox (1.0) PGP 8.0 Symantec AntiVirus Client 8.1.0.821 WinHex WinISO 5.3 WinRAR archiver WinZip 9.0 Windows Media Player Hotfix [See KB837272 for more information] Windows Media Player Hotfix [See wm819639 for more information] Windows Media Player Hotfix [See wm828026 for more information] Windows Server 2003 Hotfix - KB 818529 200311.111 Windows Server 2003 Hotfix - KB 822925 20030805.182229 Windows Server 2003 Hotfix - KB 823182 20030710.124724 Windows Server 2003 Hotfix - KB 823353 20040622.155431 Windows Server 2003 Hotfix - KB 823559 20030629.162850
After running PsInfo, a second tool from Sysinternals is useful in obtaining the Security Identifier for later searching: PsGetSID. Sample output from PsGetSID is as follows:
C:\>PsGetSID PsGetSid v1.41 - Translates SIDs to names and vice versa Copyright (C) 1999-2004 Mark Russinovich Sysinternals - www.sysinternals.com SID for \CMSSWEB: S-1-5-21-985051243-3901857598-654521942
The final piece of basic evidence collected is a general listing of all files on the system. While the file contents are not necessarily captured, the listing of the files can be examined to determine specific files to copy (in the event that a full image cannot be obtained or is not necessary) or to look for MAC dates and times on specific files.
Listing all of the files on the system is generally performed three times: once sorted by modified, once sorted by accessed, and once sorted by created times. The listings can also be imported into other programs to re- sort offline by name and folder. The three commands are as follows:
C:\> DIR /T:W /A /S /O:D C:\> DIR /T:A /A /S /O:D C:\> DIR /T:C /A /S /O:D
The /T switch indicates the date/time used for sorting, /T:W for Written (Modified), /T:A for Accessed, and /T:C for Created. The /A option lists all files (hidden and system as well). /S recursively traverses all directories. These commands should be run once from each of the drives' root directories. /O:D indicates as sort order by Date.
| Tip | All of the evidence files noted in the examples are given generic labels, but in practice the name of the evidence file can be important for differentiation at a later point. As a best practice, name the evidence file Case#-Evidence# Item#.txt, where Case# is the number of the case, Evidence# is the evidence label number for the specific machine being examined, and Item# is the specific item being collected for that machine (all of which should be recorded in the log book with details on their contents). A typical evidence file number might be C2006001-001-001.txt, for the first case in 2006 C2006001, the first piece of evidence in that case (001) and the first item in that evidence (001). |
System State Information
Overt gathering of information on the current system state has multiple associated tasks : establishing the current user of the system, determining the networked state of the computer, and obtaining the contents of the clipboard (detailed above as part of the GUI analysis).
The current users of the system are an important link in the chain of evidence. They allow the investigator to show what account or accounts are currently active to facilitate the association of specific actions (for example, having a network connection open) with a specific account. Obtaining the information on the currently active accounts is more relevant for Windows NT/2000/XP/2003 systems because activities are tied to specific accounts on these machines. An effective command line tool to determine the current users is PsLoggedOn, from SysInternals.
C:\Tools>psloggedon PsLoggedOn v1.31 - Logon Session Displayer Copyright (C) 1999-2003 Mark Russinovich Sysinternals - www.sysinternals.com Users logged on locally: <Unknown> NT AUTHORITY\LOCAL SERVICE <Unknown> NT AUTHORITY\NETWORK SERVICE 12/16/2005 10:58:44 AM CMSS\Chad M.S. Steel <Unknown> NT AUTHORITY\SYSTEM No one is logged on via resource shares.
As noted in the preceding output, four accounts are active. The Local Server, Network Service, and System accounts are standard Windows machine accounts. The account with the name Chad M.S. Steel is active and registered under the domain CMSS (and has been logged in since December 16, 2005\). Any individuals currently connected to resource shares (for example, shared drives) would be shown with this command as well.
Determining the network state of the system is threefold: determining the current network configuration, obtaining information on current network connections, and obtaining information on programs listening for new incoming connections.
The current network configuration can be obtained with the built-in Windows command ipconfig. Windows 95 machines don't have an equivalent command line option. On those systems, winipcfg brings up a graphical version of the same information. The ipconfig command returns information on all adapters and their associated network address information, as well as their other network configuration settings. The results of typing ipconfig are as follows:
C:\Tools>ipconfig /all Windows IP Configuration Host Name . . . . . . . . . . . . : CMSS Primary Dns Suffix . . . . . . . : Node Type . . . . . . . . . . . . : Hybrid IP Routing Enabled. . . . . . . . : No WINS Proxy Enabled. . . . . . . . : No Ethernet adapter Local Area Connection: Connection-specific DNS Suffix . : Description . . . . . . . . . . . : 3Com EtherLink XL 10/100 PCI For Complete PC Management NIC (3C905C-TX) Physical Address. . . . . . . . . : 00-01-22-4A-D8-96 Dhcp Enabled. . . . . . . . . . . : No IP Address. . . . . . . . . . . . : 68.42.19.63 Subnet Mask . . . . . . . . . . . : 255.255.255.0 Default Gateway . . . . . . . . . : 68.42.19.1 DNS Servers . . . . . . . . . . . : 4.2.2.1
Several key pieces of information can be obtained from the output of the ipconfig command. First, the name of the host and the DNS suffix to find the fully qualified domain name are shown. Second, the current IP address and MAC address are provided. Matching any of these addresses to network traffic is a key step in identifying an offending machine. If the machine is suspected of being an intermediary in attack, IP Routing may be enabled, allowing an attacker to forward packets through the device as if it were a router itself.
To look for additional log information on computer usage, any listed WINS, DNS Servers and Gateway devices can be good sources. Likewise, if DHCP is listed as being enabled, a DHCP server will be listed as a source for log files. The current lease date and expiration for the IP address should also be listed for dynamically assigned addresses.
| Tip | To find out the MAC and IP addresses of other devices on the same subnet, a broadcast ping can be used with arp-a . Pinging the subnet's broadcast address (for example, 68.42.19.255 for the CIDR Class C above based on the subnet mask) and typing arp-a will show any devices which respond to pings . |
Another location for network information is the ARP cache. The ARP cache retains the MAC addresses of recently accessed machines on the local subnet. Obtaining the MAC address of recent connections will show potential sources and/or destinations for machines previously connected. The ARP cache can be listed with the arp-a command:
C:\Tools>arp -a Interface: 68.42.19.63 --- 0x2 Internet Address Physical Address Type 68.42.19.63 00-01-22-4A-D8-96 dynamic 68.42.19.1 00-03-32-7F-99-1B dynamic 68.42.19.24 00-F3-A7-9B-DF-CD dynamic
Any current network connections are available through two basic Windows commands as well: netstat and nbtstat. The netstat command returns any TCP/IP connection statistics, and nbtstat does the same for NetBIOS connections. The netstat command use is as follows:
C:\Tools>netstat -an Active Connections Proto Local Address Foreign Address State TCP 0.0.0.0:135 0.0.0.0:0 LISTENING TCP 0.0.0.0:445 0.0.0.0:0 LISTENING TCP 0.0.0.0:3389 0.0.0.0:0 LISTENING TCP 68.42.19.62:23 68.42.19.63:3961 CLOSE_WAIT TCP 68.42.19.62:139 0.0.0.0:0 LISTENING TCP 68.42.19.62:1035 207.46.107.3:1863 ESTABLISHED TCP 68.42.19.62:3899 209.170.119.71:80 CLOSE_WAIT TCP 127.0.0.1:1028 0.0.0.0:0 LISTENING TCP 127.0.0.1:1036 0.0.0.0:0 LISTENING TCP 127.0.0.1:1241 0.0.0.0:0 LISTENING TCP 127.0.0.1:1242 0.0.0.0:0 LISTENING TCP 127.0.0.1:3310 127.0.0.1:3311 ESTABLISHED TCP 127.0.0.1:3311 127.0.0.1:3310 ESTABLISHED UDP 0.0.0.0:445 *:* UDP 0.0.0.0:500 *:* UDP 0.0.0.0:1029 *:* UDP 0.0.0.0:1118 *:* UDP 0.0.0.0:4500 *:* UDP 12.101.177.126:123 *:* UDP 12.101.177.126:137 *:* UDP 12.101.177.126:138 *:* UDP 12.101.177.126:1900 *:* UDP 127.0.0.1:123 *:* UDP 127.0.0.1:1037 *:* UDP 127.0.0.1:1900 *:* UDP 127.0.0.1:3410 *:* UDP 127.0.0.1:62515 *:* UDP 127.0.0.1:62517 *:* UDP 127.0.0.1:62519 *:* UDP 127.0.0.1:62521 *:* UDP 127.0.0.1:62523 *:* UDP 127.0.0.1:62524 *:*
The -a option shows all current connections as well as listening ports. The -n option shows the port name into a number. If the port is listed in the Windows list of well-known ports, leaving off the -n will show the associated protocol. The above listing displays numerous connections open, including several to the loopback (127.0.0.1) address. Recently terminated connections in the CLOSE_WAIT state to the Telnet port and HTTP ports respectively above may be of forensic interest. Likewise, the ESTABLISHED connection on port 1035 to the MSN servers is of potential interest as well. Less frequently used is the netstat -r option, which displays the routing table. If IP routing is enabled, or it is suspected an individual has static routes included on their computer, the routing table should be examined.
| Tip | The XP and 2003 versions of netstat also include an option -b , which will return the program associated with each connection. Earlier versions of Windows require another tool such as FPort to accomplish this. |
NetBIOS information similar to that available from netstat can be obtained with the nbtstat command, using both the -s and the -S options. The lowercase version shows the destination by NetBIOS name, the uppercase version lists the IP address associated with that name. Sample output of nbtstat -s showing a connection to CMSPRINT4 which has transferred a small amount of information in two directions is as follows:
C:\Tools>nbtstat -s Local Area Connection: Node IpAddress: [68.42.19.62] Scope Id: [] NetBIOS Connection Table Local Name State In/Out Remote Host Input Output ----------------------------------------------------------------- CMSS <00> Connected Out CMSPRINT4 <20> 162KB 144KB CMSS <1F> Listening
The current NetBIOS connection shown was established outbound, and there is an additional NetBIOS listener on the system shown above. A total number of bytes sent and received are shown in Input/Output respectively. A large number of bytes in one direction may indicate a file transfer or other high-bandwidth connection.
Two additional nbtstat options, -n and -c, are also useful. -n shows the local NetBIOS name resolution table, including any names that resolve differently on the specific machine being examined either maliciously or otherwise , such as the scenario where two machine with identical names are placed on the same network. The -c option displays the NetBIOS cache, which includes recent connections as well as the names of the domain controllers used by the machine, which provide an additional location to obtain log files outside of the system itself.
To find any current connections as well as listeners attached to unusual programs (for example, a port 80 listener attached to svchost ), Foundstone produced the fport tool. Fport lists all of the open ports on a system as well as the program that is associated with that port (where applicable ). The following is the output of running fport on a sample system:
C:\Tools>fport FPort v2.0 - TCP/IP Process to Port Mapper Copyright 2000 by Foundstone, Inc. http://www.foundstone.com Pid Process Port Proto Path 3196 -> 23 TCP 1924 -> 135 TCP 4 System -> 139 TCP 4 System -> 445 TCP 1544 -> 1028 TCP 1688 FIREFOX -> 3310 TCP C:\PROGRA~1\FIREFOX\FIREFOX.EXE 1688 FIREFOX -> 3311 TCP C:\PROGRA~1\FIREFOX\FIREFOX.EXE 1792 svchost -> 3389 TCP D:\WINDOWS\system32\svchost.exe 1552 -> 3925 TCP 1552 -> 137 UDP 1544 -> 138 UDP 1924 -> 445 UDP 4 System -> 500 UDP 1792 svchost -> 1029 UDP D:\WINDOWS\system32\svchost.exe 3196 -> 1118 UDP 1688 FIREFOX -> 1900 UDP C:\PROGRA~1\FIREFOX\FIREFOX.EXE 1688 FIREFOX -> 3410 UDP C:\PROGRA~1\FIREFOX\FIREFOX.EXE 4 System -> 4500 UDP 0 System -> 62515 UDP 0 System -> 62517 UDP 0 System -> 62519 UDP 0 System -> 62521 UDP 0 System -> 62523 UDP 0 System -> 62524 UDP
A final built-in program that represents a Swiss army knife of commands for obtaining network information (both local and remote) is the net command. The net command is a series of network utilities available natively in Windows that provide information on network connections ranging from share information to current sessions. The most useful net commands for forensics are as follows:
-
net localgroup . Returns a list of the local Windows groups on the current machine.
-
net session . Returns information on any currently connected (to the suspect machine) network sessions.
-
net share . Returns the list of shared directories on the current machine, including administrative shares.
-
net use . Returns the list of shared drive mappings on the machine, including both source (local drive letter) and destination (UNC name).
-
net user . Returns the list of Windows user accounts on the current system.
-
net view . Returns the browse list for the local domain, listing all machines that are immediately known to the suspect's machine.
Sample output from the net share command follows. Administrative, user, and printer shares are all listed.
C:\Tools>net share Share name Resource Remark ----------------------------------------------------------------------- D$ D:\ Default share print$ D:\WINDOWS\System32\spool\drivers Printer Drivers G$ G:\ Default share ADMIN$ D:\WINDOWS Remote Admin C$ C:\ Default share IPC$ Remote IPC SharedDocs D:\DOCUMENTS AND SETTINGS\ALL USERS\DOCUMENTS Printer DOT4_001 Spooled HP LaserJet 895 Series PCL The command completed successfully.
Running Program Information
Knowing what a suspect machine is running (in terms of programs) at a specific time can prove or disprove malicious activity. Windows systems have two basic classes of running programs: interactive programs and services. Interactive programs are started from the command line or GUI and show up in the list of running processes, viewable from the GUI by pressing Ctrl+Alt+Del. Services may be started automatically and run in the background without user interaction (or even knowledge).
| Note | Interactive programs can also be called from other programs or loaded automatically as noted in the Registry analysis chapter. |
Finding a list of running processes on Windows NT/2000/XP/2003 systems can be done with the PsList tool from Sysinternals. The software provides a listing of all running programs, their CPU usage (useful in identifying programs which are exhausting resources or actively scanning), and any associated threads.
| Note | A thread is a lightweight process that runs subservient to a main process. Many large programs are multi-threaded, but so are many worms that spawn numerous scan threads. |
There are two PsList options of use in an examination, -x and -t . The -x command line switch returns all information on running processes and their specific threads. This listing is useful for in-depth analysis of a specific program, or overall usage details on all running programs. The second option, -t , lists all running processes in a tree-like fashion. This permits a quick evaluation of which programs launched another program, and of program hierarchies. PsList -t results from an example system are as follows:
C:\Tools>pslist -t PsList 1.26 - Process Information Lister Copyright (C) 1999-2004 Mark Russinovich Sysinternals - www.sysinternals.com Process information for CMSS: Name Pid Pri Thd Hnd VM WS Priv Idle 0 0 1 0 0 16 0 System 4 8 59 506 1876 28 0 smss 1444 11 2 22 3544 124 144 csrss 1548 13 12 567 28344 2316 1888 winlogon 1572 13 18 553 53992 872 7344 services 1616 9 15 303 36300 1212 1924 svchost 240 8 6 82 29660 920 1228 svchost 340 8 14 206 37484 348 1616 spoolsv 568 8 11 120 42756 1116 3028 ccSetMgr 672 8 7 185 33752 100 2408 cvpnd 708 8 3 61 19864 612 896 DefWatch 780 8 3 27 16396 40 316 DkService 796 8 4 90 40220 780 1316 mdm 848 8 4 85 33044 440 844 nmapserv 880 8 2 36 25960 224 604 Rtvscan 928 8 44 339 107024 3312 11208 newtd 1068 8 3 99 23388 324 2236 MsPMSPSv 1128 8 2 43 13224 40 364 ccEvtMgr 1160 8 14 218 41012 48 2400 alg 1544 8 5 110 32292 212 1024 svchost 1792 8 21 229 65240 1576 2796 wisptis 756 13 3 102 28752 400 2196 LUCOMS~1 1552 8 3 200 47576 2496 5400 svchost 1924 8 10 396 37444 1116 1784 svchost 2036 8 61 1580 118064 10588 16128 lsass 1628 9 14 313 37064 892 2128 cmd 476 8 1 36 30048 252 1920 explorer 1692 8 19 788 113812 11000 23408 ccApp 908 8 9 234 52028 324 3240 cmd 996 8 1 30 30048 752 1944 iexplore 1412 8 11 920 131244 13784 25444 VPTray 1632 8 2 121 37788 436 2224 firefox 1688 8 11 247 138988 30184 40600 POWERPNT 464 8 4 186 113916 972 3756 msmsgs 2052 8 8 327 52676 2640 3168 ctfmon 2064 8 1 66 29536 468 760 WZQKPICK 2348 8 1 29 25676 180 528 cmd 2496 8 1 31 30048 996 1944 pslist 2448 13 2 81 17620 1620 712 EXCEL 3000 8 4 224 88348 2880 4336 WINWORD 3192 8 8 400 204712 23980 17692 Virtual PC 3312 8 14 326 110196 6752 13244 helix 3888 8 7 160 47188 956 10020 devldr32 2656 8 4 80 29408 220 1804 realsched 2948 8 4 111 35380 124 824
In the preceding listing, individual programs are generally listed as running one of three ways: as root programs, which are generally run at startup automatically or directly from the Run command window, such as cmd; as a subprocess to Windows Explorer, launched from the GUI; or as a service, listed under SMSS, the Session Management Subsystem, which processes user logons and the associated programs and services run from them. The PsList program itself can be seen as a subprocess to the command shell (cmd) which was launched via an Explorer shortcut (under the Explorer process). A second command shell, run from the Run command, is shown as a peer of the Explorer process under its own hierarchy.
Windows programs can also run as services roughly equivalent to daemons in the Unix world. Services are programs that run without the need for direct user interaction and can be started manually or automatically. Recent worms (for example, Nachi) as well as software of interest (for example, nmap) frequently run as services. The easiest way to display all running services is using the PsService program from SysInternals. Executing the command without any options returns all running services. Using the config option (no dash) returns the detailed settings for those services, including startup values (for example, auto or manual start). Truncated output detailing a few services from PsService is shown here:
C:\Tools>psservice more PsService v2.12 - local and remote services viewer/controller Copyright (C) 2001-2004 Mark Russinovich Sysinternals - www.sysinternals.com SERVICE_NAME: Alerter DISPLAY_NAME: Alerter Notifies selected users and computers of administrative alerts. If the service is stopped, programs that use administrative alerts will not receive them. If this service is disabled, any services that explicitly depend on it will fail to start. TYPE : 20 WIN32_SHARE_PROCESS STATE : 1 STOPPED NOT_STOPPABLE,NOT_PAUSABLE,IGNORES_SHUTDOWN) WIN32_EXIT_CODE : 1077 (0x435) SERVICE_EXIT_CODE : 0 (0x0) CHECKPOINT : 0x0 WAIT_HINT : 0x0 SERVICE_NAME: ALG DISPLAY_NAME: Application Layer Gateway Service Provides support for third party protocol plug-ins for Internet Connection Sharing and the Windows Firewall. TYPE : 10 WIN32_OWN_PROCESS STATE : 4 RUNNING (STOPPABLE,NOT_PAUSABLE,IGNORES_SHUTDOWN) WIN32_EXIT_CODE : 0 (0x0) SERVICE_EXIT_CODE : 0 (0x0) CHECKPOINT : 0x0 WAIT_HINT : 0x0 SERVICE_NAME: AppMgmt DISPLAY_NAME: Application Management Provides software installation services such as Assign, Publish, and Remove. TYPE : 20 WIN32_SHARE_PROCESS STATE : 1 STOPPED (NOT_STOPPABLE,NOT_PAUSABLE,IGNORES_SHUTDOWN) WIN32_EXIT_CODE : 1077 (0x435) SERVICE_EXIT_CODE : 0 (0x0) CHECKPOINT : 0x0 WAIT_HINT : 0x0
The config option includes the START_TYPE variable, indicating the autostart settings of a particular service. The START_TYPE , which follows shown as having a value of 4 for the ClipSrv service, indicates the service is Disabled (not startable without changing the setting). A START_TYPE of 3 indicates the service needs to be manually started and 2 that the service is started automatically ( 1 represents a service started by the system when the kernel loads and by the bootloader).
SERVICE_NAME: ClipSrv Enables ClipBook Viewer to store information and share it with remote computers. If the service is stopped, ClipBook Viewer will not be able to share information with remote computers. If this service is disabled, any services that explicitly depend on it will fail to start. TYPE : 10 WIN32_OWN_PROCESS START_TYPE : 4 DISABLED ERROR_CONTROL : 1 NORMAL BINARY_PATH_NAME : D:\WINDOWS\system32\clipsrv.exe LOAD_ORDER_GROUP : TAG : 0 DISPLAY_NAME : ClipBook DEPENDENCIES : NetDDE SERVICE_START_NAME: LocalSystem
A final command of use when analyzing programs is at, which accesses the command-line scheduler. Similar to Unix cron jobs, at returns the full list of scheduled programs and when they are scheduled to run. The output here shows an executable, generate.exe, is scheduled to run at 23:00:
C:\Tools>at Status ID Day Time Command Line ----------------------------------------------------------------------- 1 Today 11:00 PM generate.exe
Main Memory Analysis
The computer's RAM contains information on running programs, including data, instructions, and fragments from older programs. Searching main memory can yield data that was not written to disk but was generated as part of the current work session on a computer. There are three ways to analyze main memory: using Winhex, using process-specific tools such as PMDump, and dumping all of main memory to an image file for later analysis. The use of Winhex is detailed in the section on file systems. The same techniques apply to analyzing memory. The other two options are available through the command line.
The imaging of main memory causes an issue with storage. File copies of main memory can be very large. With current RAM amounts ranging into the Gigabyte range, storage of the RAM images must be done on a large removable media source (for example, USB hard disk) or transmitted across the network to an off-machine storage location. Examples of offline storage using NetCat are shown later in this section.
When determining how to image memory, the investigator needs to look toward the scope of the investigation. If there is a need to identify a single rogue process (an unreported worm, for example), dumping of a single process will result in less data to analyze. Likewise, if a single, running application is the sole target, obtaining the contents of that application's memory usage may be sufficient. For broader searching where text fragments from past data may be present, imaging the entire contents of RAM will be the most fruitful. When in doubt, imaging all of RAM and analyzing later is a prudent choice. Mapping back individual memory sections to a specific application may not be possible.
PMDump, from Arne Vidstrom, returns the contents of memory for a specific process using the process ID (PID). PMDump functions on all NT-based Windows systems but not on Windows 9 x systems. The PID for individual processes is returned by the PsList command noted above, or by using the -list switch with PMDump. PMDump produces a raw file that can be read offline with a hex editor like WinHex (or through a string searching program on the command line). The size of the file depends on the amount of memory allocated to the process being imaged . A sample PMDump command line for dumping the memory used by a WINWORD process (PID 2320) to a file dump.img is as follows:
C:\Tools>pmdump 2320 G:\dump.img pmdump 1.2 - (c) 2002, Arne Vidstrom (arne.vidstrom@ntsecurity.nu) - http://ntsecurity.nu/toolbox/pmdump/ C:\Tools>
For dumping the entire contents of memory, a large USB-based drive or network connection is required. The dd.exe executable, a Windows port of a program available for Unix systems that performs physical sector-by-sector duplications on disks, can be used to dump the entire contents of memory to an image file. The custom version of dd was developed by George Garner and works well for both disk and memory imaging and works on NT-based Windows systems.
Using the dd command requires the assignment of an input file (if) and output file (of). For memory, the input file is \\.\PhysicalMemory (the UNC name used for referencing the computer's RAM). The output file is either the name of an image file to be stored locally on a USB or similarly connected device, or piped to NetCat for remote storage. The version of dd.exe shown additionally supports the generation of MD5 hashes at the time of acquisition. Generating an MD5 hash of the contents, verifying it, and saving it to a file can be performed using the --md5sum , --verifymd5 and --md5out respectively as part of the duplication command. A sample duplication of RAM using dd is shown here:
C:\Tools>dd.exe if=\.\PhysicalMemory of=G:\RAM.img bs=4096 conv=noerror --md5sum --verifymd5 --md5out=G:\RAM.img.md5 Forensic Acquisition Utilities, 1, 0, 0, 1035 dd, 3, 16, 2, 1035 Copyright (C) 2002-2004 George M. Garner Jr. Command Line: dd.exe if=\.\PhysicalMemory of=G:\RAM.img bs=4096 conv=noerror --md5sum --verifymd5 --md5out=G:\RAM.img.md5 Based on original version developed by Paul Rubin, David MacKenzie, and Stuart Kemp Microsoft Windows: Version 5.1 (Build 2600.Professional Service Pack 2) 13/01/2005 13:41:43 (UTC) 13/01/2005 08:41:43 (local time) Current User: CMSS\Chad M.S. Steel Total physical memory reported: 392740 KB Copying physical memory... Physical memory in the range 0x00004000-0x00004000 could not be read. C:\Tools\dd.exe: Stopped reading physical memory: \ca1215ea5bd0d21f2fafa3813e53aa69 [\\.\PhysicalMemory] *G:\RAM.img Verifying output file... \ca1215ea5bd0d21f2fafa3813e53aa69 [G:\RAM.img] *G:\RAM.img The checksums do match. The operation completed successfully. Output G:\RAM.img 402649088/402649088 bytes (compressed/uncompressed) 98303+0 records in 98303+0 records out
In the listed duplication, a read block size (in bytes) is specified with the bs switch, and conv=noerror directs the program to ignore errors and continue to run. Portions of RAM may be protected by the operating system and inaccessible to direct reads. These will be skipped as necessary with this switch. The total number of bytes read or written is shown, as are any skipped portions of memory. The preceding example represents close to half a gigabyte of memory, too large to fit on a floppy disk even if greatly compressable. The number of records represents the number of blocks (blocks — blocksize = number of bytes). The resultant image file (RAM.img) and hash file (RAM.img.md5) can now be stored as evidence.
As with all forensic duplication, the copy of RAM is a snapshot in time. The act of running dd itself changes a portion of RAM. Indeed, searching for dd.exe will yield results as the process itself is utilizing memory. This is unavoidable, but the amount of alteration to memory can be minimized by not running additional programs simultaneously . Likewise, the percentage of RAM affected is minimal compared to the overall size of RAM in an average system. Analysis of the RAM is the same as that of disks. It is generally analyzed with a text editor or a search utility. These analysis techniques are covered in the Disk Analysis section.
As with the other command line options, the raw output from a large image can be piped over NetCat for storage on a remote system. The NetCat listener can be started on the remote system with the same command as before. Note the -l for the non-persistent listener, as only one file will be transferred:
C:\Tools>nc -l -p 23 >> RAMImage.img
| Note | The output can be passed on the remote machine to an md5sum program as well to obtain the immediate hash value. Alternatively, it can be stored to disk and a hash value calculated after the storage. |
The dd command can then be run on the local system and the image itself sent across through the NetCat pipe by leaving out the output file (of) option:
C:\Tools>dd if=\.\PhysicalMemory bs=4096 conv=noerror nc www.chadsteel.com 23
The error messages and diagnostic information will still be passed to standard output (the monitor) on the suspect's machine, but the data will be transmitted over the NetCat pipe. Depending on the size of the memory and the bandwidth available, transmission can take several minutes. The easiest way to monitor completeness is to watch the file size on the remote system.
| | ||
| | ||
| | ||
EAN: 2147483647
Pages: 71