The Timesheet Page
Although this solution comprises a few frames and many pages, the Timesheet.asp page is by far the most interesting and important. Furthermore, it is where all the scripting action happens. Before I discuss how I saved and loaded spreadsheets, performed validations, and added and removed projects, I want to describe how I constructed the HTML part of the page and made the Spreadsheet control look built in.
Configuring the Spreadsheet as a Data Entry Form
When you first run the Timesheet solution, you will see a page that looks like Figure 8-1. This page is a mixture of HTML, a Spreadsheet control, and two Chart controls. Notice that the spreadsheet looks built into the page and does not look much like Excel at all. There are no column and row headers, no toolbars, no blank cells to the right or below, and no scroll bars, plus the control seems to automatically resize as you add projects. The charts also have no borders, and the chart backgrounds match the background of the page itself.
Although you can use code to hide row and column headings, hide the toolbar, set the viewable range, and enable AutoFit, I chose to simply set these properties using the Property Toolbox while designing the page in Microsoft FrontPage 2000. These changes are persisted by the Spreadsheet control as parameters, and in HTML, these parameters are written as <param> tags. The parameters are then reloaded by the Spreadsheet control at runtime or during another design session, setting the initial state of the Spreadsheet control. The following HTML fragment comes from Template.htm and shows the control's <object> tag and the <param> tags just mentioned:
<object classid="clsid:0002E510-0000-0000-C000-000000000046" id=ssTimesheet style="width=600px"> <param name="HTMLData" value="...(omitted)..."> <param name="DataType" value="HTMLDATA"> <param name="AutoFit" value="-1"> <param name="DisplayColHeaders" value="0"> <param name="DisplayGridlines" value="-1"> <param name="DisplayHorizontalScrollBar" value="-1"> <param name="DisplayRowHeaders" value="0"> <param name="DisplayTitleBar" value="-1"> <param name="DisplayToolbar" value="0"> <param name="DisplayVerticalScrollBar" value="-1"> <param name="EnableAutoCalculate" value="-1"> <param name="EnableEvents" value="-1"> <param name="MoveAfterReturn" value="-1"> <param name="MoveAfterReturnDirection" value="0"> <param name="RightToLeft" value="0"> <param name="ViewableRange" value="A1:J4"> </object> |
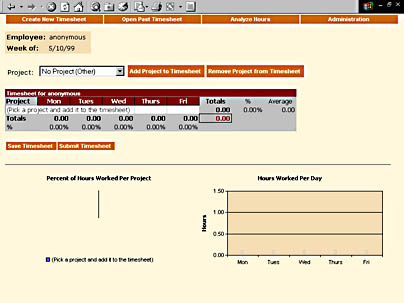
Figure 8-1. A blank timesheet.
As you can see, the names of these parameters match the names of their respective properties in the Spreadsheet control's programming model. For example, the third parameter, AutoFit, sets the Spreadsheet control's AutoFit property to the value specified in the value attribute. A value of 0 indicates False, and a value of nonzero (here -1) indicates True. Therefore, the third parameter sets the AutoFit property to True when the Spreadsheet control loads its parameters. To hide row and column headers as well as the toolbar, I set the DisplayRowHeaders, DisplayColHeaders, and DisplayToolbar parameters to 0.
As you will remember from Chapter 2, the ViewableRange property determines how much of the spreadsheet is viewable and accessible to the user. Although the spreadsheet might contain many cells, the ViewableRange property can restrict the user to seeing only those cells in the viewable range. Additionally, if the AutoFit property is set to True, the Spreadsheet control will automatically resize itself so that it is exactly the size of the viewable range and has no internal scroll bars. In this case, I set the viewable range to A1:J4, which encompasses the content of the timesheet template.
While designing the timesheet page in FrontPage 2000, I enabled protection for the spreadsheet. Enabling protection locks all cells, so the Spreadsheet control prohibits the user from editing those cells or viewing their formulas. After protecting the spreadsheet, I unlocked only the cells in which a user types his or her work hours. This information is saved in the rather long text in the value attribute of the HTMLData parameter tag. (I omitted this tag from the previous example for clarity, but you can see it in its entirety in the Template.htm file.)
I entered all other content in the timesheet template—such as the calculations for the average time spent on a project during the week, the total hours worked on a certain day, the percentage contribution to the total hours for the week, and so on—directly into the Spreadsheet control while I was working in FrontPage. The Spreadsheet component also saves this content in the HTMLData parameter and reloads it into the spreadsheet at runtime.
You can also approach initialization by using the HTMLURL property to load a template spreadsheet from another HTML file. Because Excel 2000 can save a spreadsheet in an HTML file, and because the Spreadsheet control and Excel share the same format for saved HTML, you can edit and maintain your timesheet template in Excel 2000 and load the content into the Spreadsheet control using the HTMLURL property. In the next chapter, I will demonstrate this and discuss the technique in more detail.
Binding and Formatting the Charts
As you will remember, we discussed in Chapter 3 how to bind the Chart control to the Spreadsheet control. As you would expect, the Timesheet solution uses extremely similar code to do the job. I chose to bind the charts using code instead of using the Chart Wizard in FrontPage because I knew that I would have to modify the charts' bound ranges when the user added or removed projects from the timesheet, so it was easier to perform all binding through code. The following method is called from the Window object's onLoad event handler to bind the charts to the spreadsheet:
Sub BindCharts(csPerProj, csPerDay, ss) ' Local variables Dim c ' Constants object Dim cds ' WCChartDataSource reference Dim cht ' Temporary WCChart reference Dim rngVisible ' Spreadsheet's viewable range Dim ser ' Temporary WCSeries reference Set c = csPerProj.Constants ' Set the spreadsheet as the data source Set csPerProj.DataSource = ss Set csPerDay.DataSource = ss ' Make PerProj a pie chart for total hours on projects Set cht = csPerProj.Charts.Add() cht.Type = c.chChartTypePie ' Get the viewable range of the spreadsheet Set rngVisible = ss.Range(ss.ViewableRange) ' Add a series, and bind it to the spreadsheet Set ser = cht.SeriesCollection.Add() ser.SetData c.chDimCategories, 0, "a2:a" & rngVisible.Rows.Count - 2 ser.SetData c.chDimValues, 0, "h2:h" & rngVisible.Rows.Count - 2 ' Make PerDay a second column/bar chart showing hours worked each day Set cht = csPerDay.Charts.Add() cht.Type = c.chChartTypeColumnClustered ' Add a series, and bind to the spreadsheet Set ser = cht.SeriesCollection.Add() ser.SetData c.chDimCategories, 0, "c1:g1" ser.SetData c.chDimValues, 0, "c" & rngVisible.Rows.Count - 1 & _ ":g" & rngVisible.Rows.Count - 1 End Sub 'BindCharts() |
This code starts by setting the DataSource property of each Chart control to the Spreadsheet control. This tells the Chart controls where they should get their data when the SetData method is called later. It is not necessary to use the ChartDataSources collection if you have only one data source for the chart. (For a refresher on the DataSource and DataMember properties, see Chapter 2.)
Next the code creates a chart in the Chart control representing the total hours per project and sets the chart type to Pie. The code then gets the viewable range from the spreadsheet and uses it as the mechanism for knowing what range references encompass the Project Name column and the Percentage Contribution column. Since the project names and percentage contribution values extend from the second row to the second-to-last row, you can calculate range references that encompass all the project names and all the percentage contribution values. The code continues by binding the chart's categories and values based on these calculated ranges.
Finally this code creates a chart in the second Chart control, setting its type to Clustered Column. The code uses the same technique to calculate the ranges for the chart's categories (days of the week) and values (total hours worked each day) and binds the chart dimensions to those ranges.
The Window object's onLoad event handler calls one other method to format the charts, which is shown here:
Sub FormatCharts(csPerProj, csPerDay) ' Local variables Dim c ' Constants object Dim cht ' Temporary WCChart reference Dim ax ' Temporary WCAxis reference Dim dl ' Temporary WCDataLabels reference Set c = csPerProj.Constants csPerProj.Border.Color = document.bgColor csPerProj.Interior.Color = document.bgColor csPerDay.Border.Color = document.bgColor csPerDay.Interior.Color = document.bgColor ' Format the per-project chart Set cht = csPerProj.Charts(0) cht.HasTitle = True cht.Title.Caption = "Percent of Hours Worked Per Project" cht.Title.Font.Name = "Tahoma" cht.Title.Font.Size = 8 cht.Title.Font.Bold = True cht.HasLegend = True cht.Legend.Position = c.chLegendPositionBottom cht.Legend.Interior.Color = document.bgColor cht.Legend.Border.Color = document.bgColor ' Format the per-day chart Set cht = csPerDay.Charts(0) cht.HasTitle = True cht.Title.Caption = "Hours Worked Per Day" cht.Title.Font.Name = "Tahoma" cht.Title.Font.Size = 8 cht.Title.Font.Bold = True cht.PlotArea.Interior.Color = "wheat" ' Set and format the value axis title Set ax = cht.Axes(c.chAxisPositionLeft) ax.HasTitle = True ax.Title.Font.Name = "Tahoma" ax.Title.Font.Size = 8 ax.Title.Caption = "Hours" ax.Title.Font.Bold = True ' Set the series color cht.SeriesCollection(0).Interior.Color = "darkred" ' Add data labels, and show the values only Set dl = cht.SeriesCollection(0).DataLabelsCollection.Add() dl.Font.Name = "Tahoma" dl.Font.Size = 8 dl.Font.Color = "silver" dl.Position = c.chLabelPositionInsideEnd End Sub 'FormatCharts() |
Chart-formatting code should be quite familiar to you now; however, one point is worth noting in this example. To make the charts appear built into the page, I set each Chart control's border and interior color to the same color as the surrounding page. I did this by passing the value returned from the document.bgColor property to the Color property of the Chart control's Border and Interior objects. Because the Office Web Components accept any color name, or any hexadecimal or RGB value you might use in HTML, you can directly assign colors from the surrounding HTML document to make the element's color match. As you will remember from Chapter 6, you also can use the common script routine FormatChartFromStyles. In this case, however, I wanted to show you how to manually perform this technique.
The rest of the code in this method creates titles and applies formatting. Note that I also set the legend's interior color and border to the same color as the document. This again creates the effect of the legend being built into the page rather than being separate from it. I also placed the legend at the bottom of the pie chart so that it leaves more room for the actual pie. Since users commonly have up to three projects in their timesheet, this arrangement is much more space efficient.
You might be wondering why I did not use only one Chart control and create two charts in the chart space. Remember that charts within the same chart space share a master set of categories. Since the charts in the Timesheet solution do not have the same set of categories (project names vs. days of the week), you cannot put them in the same chart space and keep each chart's categories separate. If you do put them in the same chart space, both charts' categories set will be the union of all categories. Conveniently, Microsoft Internet Explorer allows you to size controls to a percentage of the containing element (in this case, the entire page), so you can easily keep the Chart controls equally spaced on the same horizontal line by setting their width attributes to a percentage value:
<object classid="clsid:0002E500-0000-0000-C000-000000000046" id=csPerProj width="49%" height="200"> </object> <object classid="clsid:0002E500-0000-0000-C000-000000000046" id=csPerDay width="50%" height="200"> </object> |
EAN: 2147483647
Pages: 111