2.1 Introduction
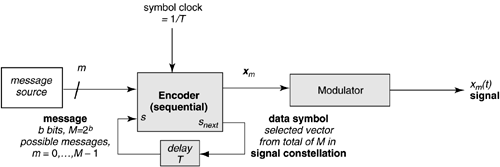
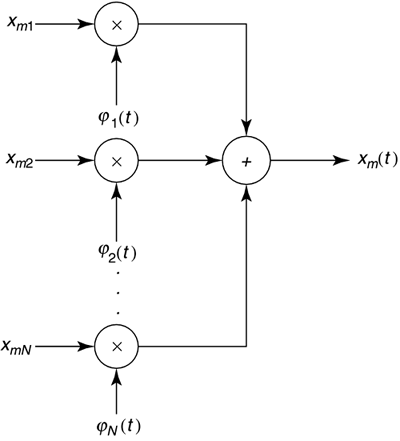
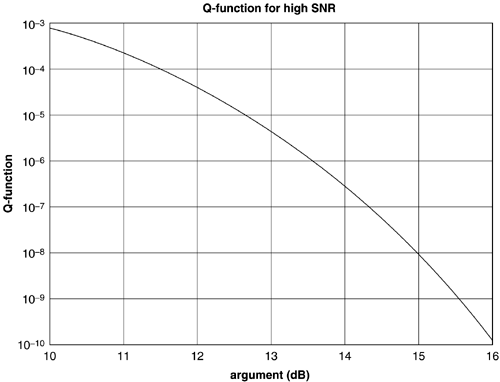
| This chapter provides summary of useful concepts and formulae for the transmission-systems basics that have been applied to DSL systems. A more comprehensive treatment for DSL occurs in a predecessor to this book [1], and the reader can refer to that earlier book for more details and derivations . The intent is the successful use of these formulae and principles in DSL-system simulations and performance-feasibility studies. Section 2.2 reviews the transmission methods used in the earliest DSL systems that were primarily baseband systems (i.e., systems with no analog POTS simultaneously preserved on the same line as the DSL), whereas Section 2.3 provides the same for the later DSL methods of QAM/CAP and multicarrier methods, particularly DMT. More details on all are found in [1], and the DMT method in particular will appear also in Chapters 3, 7, and 11 of this book. Section 2.4 concludes by summarizing some simple impairment models: background noise and NEXT and FEXT coupling models. All transmission channels are fundamentally analog and thus may exhibit a variety of transmission effects. In particular, telephone lines are analog, and so DSLs all use some form of modulation . The basic purpose of modulation is to convert a stream of bits into equivalent analog signals that are suitable for the transmission line. Figure 2.1 depicts a digital transmission system. The transmitter converts each successive group of b bits from a digital bit stream into one of 2 b data symbols, x m , via a one-to-one mapping known as an encoder. Each group of b bits constitutes a message m , with M = 2 b possible values m = 0, ..., M - 1. The data symbols are N -dimensional (possibly complex) vectors, and the set of M vectors forms a signal constellation. Modulation is the process of converting each successive data symbol vector into a continuous-time analog signal { x m ( t )} m =0,..., M -1 that represents the message corresponding to each successive groups of b bits. The message may vary from use to use of the digital transmission system, and thus the message index m and the corresponding symbol x m are considered to be random, taking one of M possible values each time a message is transmitted. This chapter assumes that each message is equally likely to occur with probability 1 /M. The encoder may be sequential, in which case the mapping from messages to data symbols can vary with time as indexed by an encoder state, corresponding to n bits of past state information (function of previous input bit groups). There are 2 v possible states when the encoder is sequential. When n = 0, there is only one state and the encoder is memoryless. Figure 2.1. Transmitter of a digital transmission system. Linear modulation also uses a set of N , orthogonal unit-energy basis functions, { The n th basis function corresponds to the signal waveform component produced by the n th element of the symbol x m . [1] Different line codes are determined by the choice of basis functions and by the choice of signal constellation symbol vectors, x m , m = 0, , M -1. Figure 2.2 depicts the function of linear modulation: For each symbol period of T seconds, the modulator accepts the corresponding data symbol vector elements, x m 1 , ..., x mN , and multiplies each by its corresponding basis function,
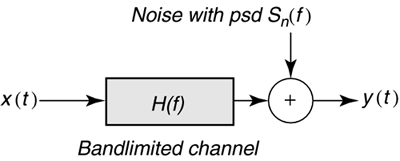
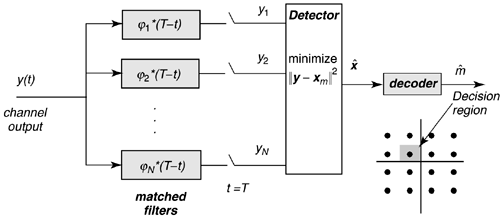
Figure 2.2. Linear modulator. The average energy, E x , of the transmitted signal can be computed as the average integrated squared value of x(t) over all the possible signals, or more easily by finding the average squared length of the data symbol vectors, The digital power of the transmitted signals is then S x = E x /T . The analog power, P x , is the digital power at the source driver output divided by the input impedance of the channel when the line and source impedances are real and matched. Generally, analog power is more difficult to calculate than digital power. Transmission analysts usually absorb the gain constants for a specific analog driver circuit into the definitions of the signal constellation points or symbol vector values x m and the normalization of the basis functions. The digital power is then exactly equal to the analog power, effectively allowing the line and analog effects to be viewed as a 1-ohm resistor. The channel in Figure 2.3 consists of two potential distortion sources: bandlimited filtering of the transmitted signals through the filter with Fourier transform H(f) and additive Gaussian noise (unless specifically discussed otherwise ) with zero mean and power spectral density S n ( f ). The designer should analyze the transmission system with an appropriately altered Figure 2.3. Bandlimited channel with Gaussian noise. 2.1.1 The Additive White Gaussian Noise (AWGN) channel The additive white Gaussian noise (AWGN) channel is the most heavily studied in digital transmission. This channel simply models the transmitted signal as being disturbed by some additive noise. It has H ( f ) = 1, which means there is no bandlimited filtering in the channel (clearly an idealization). If the channel is distortionless, then H(f) = 1 and s 2 = 0. On a distortionless channel, the receiver can recover the original data symbol by filtering the channel output y(t) = x(t) with a bank (set) of N parallel matched filters with impulse responses Figure 2.4. Demodulation, detection, and decoding. Such a detector is known as a maximum likelihood detector, and the probability of an erroneous decision about x (and thus the corresponding group of b bits) is minimum. This type of detector is only optimum when the noise is white, Gaussian, and the channel has very little bandlimiting ( essentially infinite bandwidth) and is known as a symbol-by-symbol detector. Each matched filter output has independent noise samples (of the other matched-filter output samples), and all have mean-square noise sample value s 2 . Thus the SNR is Detector implementation usually defines regions of values for y that map through the ML detector into specific input values. These regions are often called decision regions. An error occurs when Symbol vectors in a constellation will each have a certain number of nearest neighbors at, or exceeding , this minimum distance, N m . The average number of nearest neighbors is which essentially counts the number of most likely ways that an error can occur. So, the probability of error is often accurately approximated by where the Q-function is often used by DSL engineers . The quantity Q ( x ) is the probability that a unit-variance zero-mean Gaussian random variable exceeds the value in the argument, x, The Q-function must be evaluated by numerical integration methods, but Figure 2.5 plots the value of the Q-function versus its argument (20 log(x)) in decibels. For the physicist at heart, Figure 2.5. Q function versus SNR. 2.1.2 Margin, Gap, and CapacityIt is desirable to characterize a transmission method and an associated transmission channel simply. Margin, gap, and capacity are related concepts that allow such a simple characterization. Many commonly used line codes are characterized by a signal-to-noise ratio gap or just gap . The gap, G = G ( P e ,C), is a function of a chosen probability of symbol error, P e , and the line code, C. This gap measures efficiency of the transmission method with respect to best possible performance on an additive white Gaussian noise channel, and is often constant over a wide range of b (bits/symbol) that may be transmitted by the particular type of line code. Indeed, most line codes are quantified in terms of the achievable bit rate (at a given P e ) according to the following formula: Thus, to compute data rate with a line code characterized by gap G , the designer need only know the gap and the SNR on the AWGN channel. An experienced DSL engineer usually knows the gaps for various line codes and can rapidly compute achievable data rates in their head. The SNR may be higher for better transmission modulation, but the gap is a function only of the encoder in Figure 2.1. An optimum line code with a gap of G = 1 (0 dB) achieves a maximum data rate known as the channel capacity. Such an optimum code necessarily requires infinite complexity and infinite decoding/encoding delay. However, it has become practical at DSL speeds to design coding methods for which the gap is as low as 1 “2 dB. It is also possible when combining such codes with DMT to achieve capacity in DSL systems. Often, transmission systems are designed conservatively to ensure that a prescribed probability of error occurs. The margin of a design at a given performance level is the amount of additional signal to noise ratio of the design in excess of the minimum required for a given code with gap G . The margin can be computed according to |
| Top |
EAN: 2147483647
Pages: 154
