PLOTTING
So far we have discussed various statistical tests to measure the strength of a relationship between two variables. Another way to evaluate the relationships between variables is plotting. The graphical representation makes the evaluation much easier and provides a good starting point for further investigation. Reference lines on plots can make it easier to see the patterns that indicate relationships in the data.
Plotting data is one of the best ways to look for relationships and patterns. A plot is simple to understand and conveys a lot of information about the data. In other chapters, we discussed methods of summarizing and describing relationships, but those methods are no substitute for plots. Whenever possible, you should plot the data first, and then think about appropriate methods for describing the plots. We made this point earlier in our discussion about histograms.
A plot can also alert you to possible problems in the data. For example, if you are plotting salary and age, and you find a 22-year-old with a salary of $100,000, you have reason to be suspicious. Although the values may be correct, it is much more likely that either the age or the salary was recorded or entered incorrectly. You would not have been able to pick out this point as suspicious if you examined the variables individually. A salary of $100,000 is high but possible. An age of 22 is not unusual. It is the combination of the values that leads you to suspect the point may be a mistake. Even if the point is correct, it is important to identify it early, since it may need special treatment in later analyses.
With the analysis of the data and the plotting we can see if the variables under study "appear to be related." What do we mean by related here? Nothing really complicated. Two variables are related if knowing the value of one variable tells us something about the value of the other variable. Neither of the variables has to be considered dependent or independent. All we are interested in is how they behave together. Usually the behavior is shown as a straight line through the data.
Five fundamental types of relationships are possible: (a) strong positive relationship, (b) weak positive relationship, (c) no relationship, (d) strong negative relationship and (e) weak negative relationship. These relationships are shown in Figure 8.1.
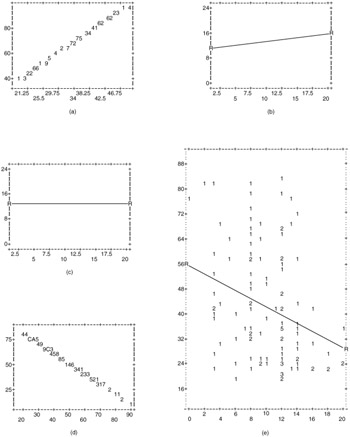
Figure 8.1: Five types of relationships.
In real life, linear relationships look more like a cluster of points scattered all around with a straight line through the center of the points. Figure 8.2 shows an example. The points are clustered around the line, but most of them do not fall exactly on it. Instead they are distributed around it. You can see quite a bit of variability around the line, but most points are not too far removed. That is OK, because you can still see that the relationship is positive, since as one variable moves in one way so does the other. Remember we are interested only in the direction and magnitude of the relationship. To find the best place to draw the line we use the regression method, which we will cover later.
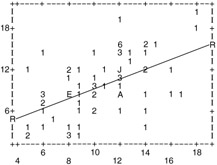
Figure 8.2: A relationship with points scattered around a straight line.
How can you display the relationship between two variables that are measured on an interval or ratio scale? Here is a summary:
-
A plot displays the values of two variables for each case.
-
By examining a plot, you can see what sort of relationship, if any, exists between two variables.
-
The points on a plot may be identified by their values on an additional variable (called a control variable). This lets you see whether the relationship between the two variables differs for the different categories of the control variable.
-
Points that have unusual combinations of values can be identified from a plot, since they will be far removed from the other cases.
EAN: 2147483647
Pages: 252