EVALUATING A DIFFERENCE BETWEEN MEANS
How can you decide when a difference between two means is big enough for you to believe that the two samples are from a population with different means? It depends on how willing you are to be wrong. Look at Figure 5.1, which is the real distribution of differences for samples of size 20 from a distribution with a standard deviation of 15. (You can calculate the standard deviation of the distribution of differences. It is called the standard error of the difference.) Since the distribution is normal, you can find out what percentage of the samples falls into each of the intervals.
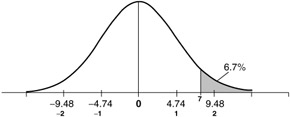
Figure 5.1: Theoretical distribution of differences of means.
The scale on the distribution is marked with the actual values and with "standardized" values, which are computed by dividing the differences by the standard error. Looking at standardized distances is convenient , since the percentage of cases within a standardized distance from the mean is always the same. For example, 34% of all samples are between zero and one standardized unit greater than the mean, and another 34% are between zero and one standardized unit less than the mean. If you always express your distances in standardized units, you can use the same normal distribution for evaluating the likelihood of a particular difference.
From Figure 5.1, you can see that about 13% of the time, you would expect to have at least a 7-point difference in the sample means when two population means are equal. Why? You just found out that the 7-point difference is 1.5 standard errors. Look on the figure to see what percentage of the differences is that big. You should look at the area to the right of +1.5 and the area to the left of -1.5. Since the distribution is symmetric, the two areas are equal. Each one is about 6.7% of the total, and together they make up a little over 13% of the total. So about 13% of differences in means are going to be as big as 1.5 standard errors (or 7 points) if the real difference in means is zero.
EAN: 2147483647
Pages: 252