CONTROL CHARTS AND MEASUREMENT STABILITY
Stability describes the consistency of a measuring system over relatively long periods of time. Basic measurement error analysis is a screening study used to assess the short- term repeatability and reproducibility of a measuring system. Obtaining additional measurements of the same parts or test specimens is needed to describe the stability of the measurement process. Additional measurements of the same parts means expanding the number of trials made for the basic measurement error analysis. When sufficient trials are made for the same set of parts , a control chart can be constructed as a description of the repeatability distribution. Plotting repeatability across a control chart allows the analyst to search for unusual sources or special causes of measurement error.
The data illustrated in Figure 15.16 show how a control chart enhances the assessment of a measuring system. The outside diameter of a motor armature shaft was measured with an electronic gage. The gage had a set of mechanical probes that touched the outside diameter of the shaft and illuminated a column of LEDs when a part was held in the test fixture. Large-diameter shafts produced a high column of lights, and small-diameter shafts made a low column of lights. The gage has a scale resolution of 0.0005 inches. The instrument was calibrated with a master so that the nominal dimensions equaled zero. After the instrument was calibrated, the master was remeasured 25 consecutive times.
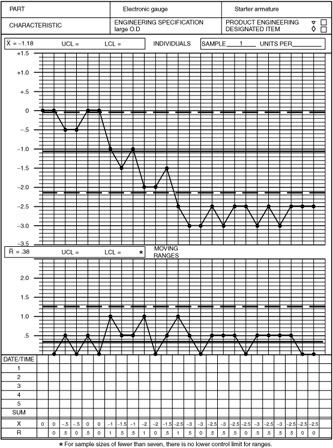
Figure 15.16: Control chart measuring stability.
Although the sample size for this study was very small ( n = 1) and a nearly perfect test specimen was used, this study demonstrated the instability of the measuring system. After six trials, a downward trend was observed . This measuring device was removed from the production floor because its instability contributed to high levels of error due to lack of measurement repeatability, reproducibility, and accuracy. Measurement instability would not be uncovered by the short-term basic measurement error analysis.
EAN: 2147483647
Pages: 181