Logging ISA Traffic
| One of the most powerful troubleshooting tools at the disposal of SharePoint and ISA administrators is the Logging mechanism, which gives live or archived views of the logs on an ISA Server, and allows for quick and easy searching and indexing of ISA Server log information, including every packet of data that hits the ISA Server. NOTE Many advanced features of ISA logging are available only when using MSDE or SQL databases for the storage of the logs. Examining ISA LogsThe ISA logs are accessible via the Logging tab in the details pane of the Monitoring node, as shown in Figure 16.13. They offer administrators the ability to watch, in real-time, what is happening to the ISA Server, whether it is denying connections, and what rule is being applied for each Allow or Deny statement. Figure 16.13. Examining ISA logging.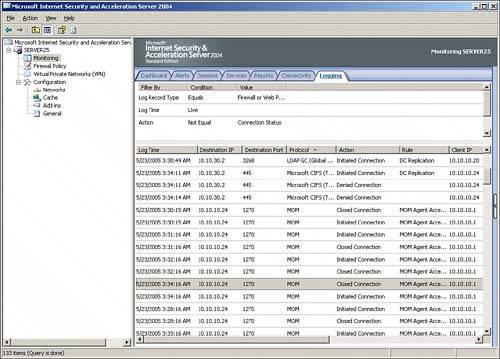 The logs include pertinent information on each packet of data, including the following key characteristics:
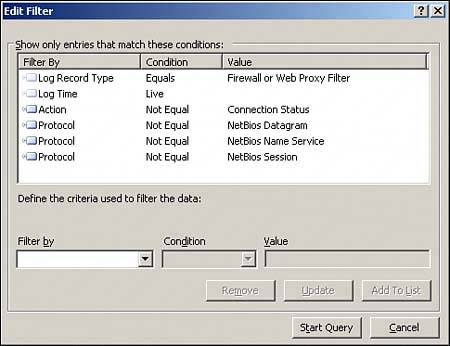
By searching through the logs for specific criteria in these columns, such as all packets sent by a specific IP address, or all URLs that match http://sharepoint.companyabc.com, advanced troubleshooting and monitoring are simplified. Customizing Logging FiltersWhat is displayed in the details pane of the Logging tab is a reflection of only those logs that match certain criteria in the log filter. It is highly useful to use the filter to weed out the extraneous log entries that distract from the specific monitoring task. For example, on many networks, an abundance of NetBIOS broadcast traffic makes it difficult to read the logs. For this reason, a specific filter can be created to show only traffic that is not NetBIOS traffic. To set up this particular type of rule, do the following:
NOTE It cannot be stressed enough that this logging mechanism is literally the best tool for trouble shooting ISA access. For example, it can be used to tell whether traffic from clients is even hitting the ISA Server, and if it is, what is happening to it (denied, accepted, and so on). |
EAN: 2147483647
Pages: 288