Microsoft Excel
| |
Microsoft Excel, again because of its complexity, has a large object model, so we're only going to look at one specific area - charts . Getting data into Excel is extremely simple from within Excel itself, and you can link data much more easily than you can with Word, so that's why we're not going to look at it here. However, if you're building an application, you generally have to provide some form of reporting, for all those managers and accountants . They like that sort of thing.
One of the great things about Access is that you can use objects from other applications on your forms. This is particularly useful for adding charts to your applications. So in this example, we're going to do our automation a little differently. Instead of creating an instance of an application, we're going to put the instance on a form, as a visible object.
Try It Out-A Chart on a Form
-
In Access, create a new query without any tables or queries on it. From the Query menu, select SQL Specific , and then Union .
-
Type the following SQL statement into the blank window:
SELECT -1 As CompanyID, "<All>" As CompanyName FROM tblCompany UNION SELECT CompanyID, CompanyName FROM tblCompany ORDER BY CompanyName
-
Close the query, saving it as qryCompanyLookup . Create another new query, adding tblCompany and tblSales .
-
Add the CompanyName and Quantity fields, then into the next empty field add the following:
MonthName: Format([DateOrdered], "mmmm") -
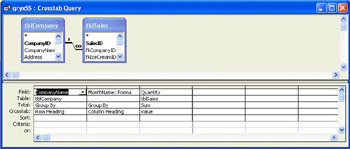
From the Query toolbar select Crosstab Query .
-
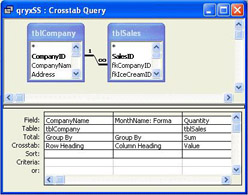
In the CompanyName column, set the Total entry to Group By and the Crosstab entry to Row Heading . Then, in the MonthName column set the Total entry to Group By and the Crosstab entry to Column Heading . Finally, in the Quantity column set the Total entry to Sum and the Crosstab entry to Value .
-
Your query should now look like this:
-
From the View menu select Properties , and add the following into the Column Headings field:
January;February;March;April;May;June;July;August;September;October;November;DecemberNote: This should all be on the same line when you type it in.
-
Close the query, saving it as qryxSS .
-
Create another query, based upon qryxSS . Add all of the fields to the query, and change each of the month fields so that the name is the abbreviated month name , and they use the Nz function to return if the field is null. This might be easier to do in SQL view, where the query will look like this:
SELECT qryxSS.CompanyName, Nz(January,0) AS Jan, Nz(February,0) AS Feb, Nz(March,0) AS Mar, Nz(April,0) AS Apr, Nz(May,0) AS May, Nz(June,0) AS Jun, Nz(July,0) AS Jul, Nz(August,0) AS Aug, Nz(September,0) AS Sep, Nz(October,0) AS Oct, Nz(November,0) AS Nov, Nz(December,0) AS [Dec] FROM qryxSS;
-
Close the query, saving it as qryxSalesSummary . Now create a new form and add a combo box at the top. Name the combo box cboCompany , and change the label accordingly .
-
Set the Row Source Type to Table/Query and the Row Source to qryuCompanyLookup . Then set the Column Count to 2 and Columns Widths to .
-
Put a checkbox next to the combo box. Call it chkLegend and change the label to Show Legend .
-
From the toolbox select Unbound Object Frame and draw a large frame on the form, underneath the other two controls. From the Insert Object dialog, make sure that Create New is selected, and pick Microsoft Graph 2000 Object , before pressing the OK button. Your form will now look something like this:
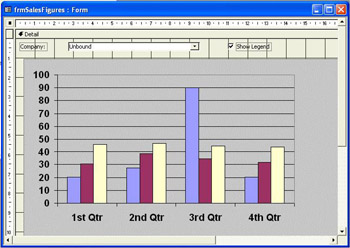
Don't worry about what the data is or what the graph looks like. We'll be changing that later.
-
Click on the form background, to the side of the new object, and the graph deactivates. Now view the properties for the graph object. Set the Name to ctlChart , the Row Source Type to Value List, and the Column Heads to Yes . Then save the form as frmSalesFigures .
-
Press the Code button to create a code module, and from the Tools menu select References . Make sure the Microsoft Graph 10.0 Object Library is checked, before pressing the OK button. Now add the following module level variable to the new module:
Private m_objChart As Graph.Chart -
In the Click event for chkLegend add this code:
m_objChart.HasLegend = chkLegend -
In the Load event for the Form add the following:
Set m_objChart = ctlChart.Object -
In the Unload event for the Form add the following - this will clear the memory used by the object variable:
Set m_objChart = Nothing -
In the Change event for cboCompany add the following:
Private Sub cboCompany_Change() On Error Goto cboCompany_Change_Err Dim strSQL As String If cboCompany = -1 Then strSQL = "qryxSalesSummary" Else strSQL = "SELECT * FROM qryxSalesSummary WHERE CompanyName=""'" & _ cboCompany.Column(1) & """'" End If ctlChart.RowSource = strSQL ctlChart.RowSourceType = "Table/Query" With m_objChart .ChartArea.Font.Size = 8 .HasLegend = chkLegend If cboCompany = -1 Then .ChartType = xl3DColumn .Refresh .Axes(xlSeriesAxis).HasTitle = False Else .ChartType = xl3DColumnStacked .Refresh End If With .Axes(xlCategory) .HasTitle = True .AxisTitle.Caption = "Month" End With With .Axes(xlValue) .HasTitle = True .AxisTitle.Caption = "Total Sales" End With End With cboCompany_Change_Exit: Exit Sub cboCompany_Change_Err: If Err.Number = 1004 Then m_objChart.Refresh Else Err.Raise Err.Number, Err.Source, Err.Description, _ Err.HelpFile, Err.HelpContext End If End Sub
-
Save the code and switch back to Access. Now switch the form into form view. The Company combo box will be empty, so select Amethyst Group :
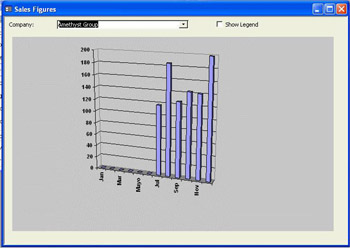
Pretty cool, huh? A chart of all sales for this company. Now select < All > from the combo box:
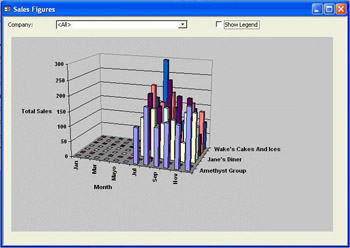
Even cooler . Clicking the Show Legend check box shows the legend for the various companies - they aren't all shown because there isn't room to show them all - this also happens with the month names .
How It Works
Let's first start with the queries, starting with qryuCompanyLookup . This is a UNION query, which joins two sets of data together. Why do we want to do this? Well, what we want on the form is a way for the user to choose either a single company or all companies. You could have a combo box of companies and a checkbox for all companies, but this just seems a bit confusing. What's better is a single combo that shows < All > as the first record, and then the companies underneath that. So that's what this query does.
The first SELECT statement is used to produce the < All >, and shows a feature of SQL that you might not have seen before - you don't actually have to select data from a table. Here we are selecting two values of our choosing. Notice that we've used column aliases, giving our two values proper column names. That's because the columns in the two select statements must match:
SELECT -1 As CompanyID, "<All>" As CompanyName FROM tblCompany
On its own this gives:
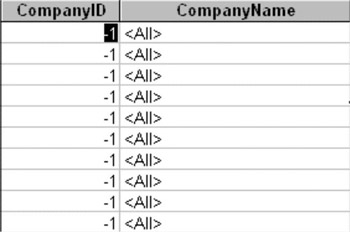
This is because we are selecting from a table but not selecting columns from that table, so we get a row in the output for each row in the table. But, because we are supplying our own values for the columns, all of the rows are the same:
This in fact points to a bug in JET SQL, because you should be able to do SELECT -1 As CompanyID, " < All > " As CompanyName without the FROM clause. However, JET reports this as an error.
Next we use the UNION statement to say that we want to join the first query with the second:
UNION
The second query is a normal SELECT statement.
SELECT CompanyID, CompanyName FROM tblCompany ORDER BY CompanyName
Having looked at the diagram above you might think that our combo box would show several rows of < All >, but by default a UNION query only shows unique records, so all of the duplicate values are stripped out.
This UNION technique is a great way to allow users to select one or all values from a table. One thing to note about UNION queries is that both of the queries must contain the same number of columns, otherwise errors will be generated.
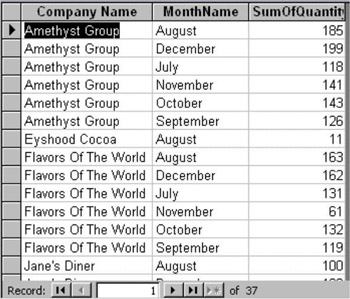
OK, let's look at the crosstab query now. Crosstab queries allow us to make a row value become a column. So if we look at a non-crosstab version of this query:
This gives a result of:
What we want is one row for each company, with the month names as columns. So a crosstab query allows us to specify three things:
-
Row Heading, which will be CompanyName .
-
Column Heading, which will be MonthName .
-
Value, which will be SumOfQuantity .
However, on its own this just gives us:
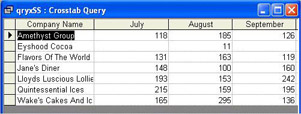
What about all of the rest of the months, for which there is no data? They don't appear for that very reason - there is no data. A column is only created if there is a MonthName for it. To get column names for all of the months we have to specify the columns, and we do this by setting the Column Headings property of the query. This makes sure that we get a column for each month, even if there is no data.
This, however, still isn't complete, as cells with no data show up as empty, rather than . This isn't a problem here, but will be a problem when we try to create the graph. So, what we do is create another query based on our crosstab query, using the Nz function to return if the column is null. Only now do we have the correct query.
Let's move onto the form now. The combo box just takes its values from the union query, and the checkbox is straightforward too. The Object Frame might be a new control to you though. You already know what objects are, so this is just a way to embed one of these objects on a form. In this case our object frame is used to contain a graph. If you've ever used graphs in Excel, then this isn't really any different, because the graph is a separate object. When you create a graph in Excel you are embedding a graph object in your spreadsheet.
Like many other controls the graph control on the form can be bound to a data source. To stop the graph trying to display data when it first loads we set the Row Source Type property to Value List . We also set the Column Heads property to Yes - for some reason this is required for the data to display correctly, but the reason is not documented.
Now let's move onto the code, starting with the global variables . To save lots of unnecessary referencing, we have a variable that will point to the chart:
Private m_objChart As Graph.Chart
So when the form loads we can do this:
Set m_objChart = ctlChart.Object
This points to the chart object. This is an important point because you have to differentiate from the chart control and the chart object. The chart control is the visible control on the form, which is what Access controls. This includes things such as the height, width, border, etc., and is really how we, as the user, see the control. The chart object is the underlying chart, and is what controls the chart itself.
For the checkbox we only have one line of code - to change whether the chart has a legend or not, using the HasLegend property:
m_objChart.HasLegend = chkLegend
Now comes the real guts, as this is the code for the Change event of the combo box. Firstly we set some error handling - I'll explain why later:
Private Sub cboCompany_Change() On Error Goto cboCompany_Change_Err
Next we declare a string, which will hold the SQL statement - this is what we are going to use as the source of the chart data:
Dim strSQL As String
Now we need to set this SQL statement. Remember how our union query has -1 as the CompanyID for the < All > value - this allows us to identify in code whether < All > has been selected. If it has, we want to use all of the data from the crosstab query - remember that this contains data for every company:
If cboCompany = -1 Then strSQL = "qryxSalesSummary"
If a company has been selected we only want to show values for that company, so we build a SQL string just picking out the correct values:
Else strSQL = "SELECT * FROM qryxSalesSummary WHERE CompanyName=""'" & _ cboCompany.Column(1) & """'" End If
We now set the source of the data for the chart, also setting the type of data to be a table or a query. We couldn't do this at design time because the source of the data wasn't known and an error would have occurred. Now we know the source of the data, it's safe to set it here:
ctlChart.RowSource = strSQL ctlChart.RowSourceType = "Table/Query"
Now we need to set some properties of the chart:
With m_objChart
We start with the font size. The ChartArea property applies to the whole chart, so allows us to set the font size for all aspects of the chart:
.ChartArea.Font.Size = 8
Then we set the legend property.
.HasLegend = chkLegend
If the user selects all companies, then we need to show a multi-dimensional graph. So we set the ChartType property to be a 3D Column.
If cboCompany = -1 Then .ChartType = xl3DColumn
Next we Refresh the chart, because we want to set some properties that are dependent upon the chart type. One of those is setting a title for one of the axis. When you have a 2D graph you only have the X and Y axes, but a 3D graph has a Z axis as well. This axis doesn't exist if the chart is 2D, but does if 3D, so we use Refresh to ensure that all axes are visible. We then turn off the Title for this axis.
.Refresh .Axes(xlSeriesAxis).HasTitle = False
For a single company, we want a two-dimensional graph, so we use a different ChartType .
Else .ChartType = xl3DColumnStacked .Refresh End If
Now we can deal with the X and Y axes, making sure that the title is visible, and the caption for the axis is set appropriately.
With .Axes(xlCategory) .HasTitle = True .AxisTitle.Caption = "Month" End With With .Axes(xlValue) .HasTitle = True .AxisTitle.Caption = "Total Sales" End With End With
That's it, so we can simply exit.
cboCompany_Change_Exit: Exit Sub
The error handling here is a bit of a kludge , and is purely included to get around a timing problem. We've already mention that we use Refresh to ensure that properties are updated. There are occasionally times when trying to set a property occurs before that property is available, and an error is generated. So, we check the error number to see if it means that the property isn't available, and just Refresh to ensure it is. Any other error is sent back to the default error handler.
cboCompany_Change_Err: If Err.Number = 1004 Then m_objChart.Refresh Else Err.Raise Err.Number, Err.Source, Err.Description, _ Err.HelpFile, Err.HelpContext End If End Sub
The final thing to do is to clean up the object reference when the form is closed.
Set m_objChart = Nothing
That's all there is to it. Although it may look complex, we are really only dealing with a few properties. If you create a chart in Excel and use the dialog boxes and toolbars to modify the properties, you'll see a similar kind of result.
Graph Summary
The main properties we've looked at have been:
-
ChartType identifies what type of chart you want to see.
-
HasLegend identifies whether or not a legend is shown on the chart.
-
Axes(xlCategory) identifies the X axis.
-
Axes(xlValue) identifies the Y axis.
-
Axes(xlSeriesAxis) identifies the Z axis, if it exists.
Axes is a collection containing objects of type Axis , so these have their own properties too.
Office Assistant
Since we're near the end of the book, and the rest of this chapter has been pretty sensible , let's just have a quick look at the Office Assistant to lighten the load a little. You need to make sure that the Office Assistant is installed for this example.
To save you a lot of unnecessary typing, import the form frmAssistant from IceCream.mdb . Switch to the code module, and from the Tools menu pick References , making sure you check the Microsoft Office 10.0 Object Library before pressing the OK button. Now switch back to Access and open the form in form mode. Use the combo box to select the action for your assistant. Pretty fun, eh? You can look at the code here in more detail if you like, to see how you can use the Office Assistant yourself.
| |
EAN: 2147483647
Pages: 256