KMDF Walkthrough: Debugging the Osrusbfx2 Sample
This section shows how to use WinDbg with the KMDF Osrusbfx2 sample, starting with the EvtDriverDeviceAdd callback routine which is a key part of the driver load and startup code. As with the UMDF example, the Osrusbfx2 sample has no known bugs, but using WinDbg to walk through the source code is a convenient way to demonstrate the basics of how to use WinDbg with KMDF drivers.
Prepare for a Debug Session for Osrusbfx2
These steps apply to the information presented in "How to Prepare for KMDF Debugging" earlier in this chapter.
To Prepare the Systems for Debugging
-
Build the driver, and then install it on the test computer.
-
Build the Osrusbfx2 test application, and then copy it to a convenient folder on the test computer.
-
Prepare the computers for debugging, as described earlier in this chapter:
-
Enable kernel debugging for the version of Windows running on the test computer.
-
Enable KMDF debugging features in the test computer's registry.
-
Start the Debug Session for Osrusbfx2
After you have prepared the system, you can start the session by using the procedures defined in "How to Start a KMDF Debugging Session" earlier in this chapter.
To Start the Debugging Session
-
Run WinDbg and put it in kernel-debugging mode.
-
Use the break command to force the test system to break into the debugger.
-
Use the bp command to set a deferred breakpoint at the beginning of the driver's EvtDriverDeviceAdd callback routine, as follows:
-
bp OsrFxEvtDeviceAdd
-
-
Open a source window for Device.c.
-
Insert the Fx2 device into the test computer.
-
Use the g command to instruct the test computer to continue.
The test computer starts loading the Osrusbfx2 driver and then breaks into the debugger when the framework calls OsrFxEvtDeviceAdd. The routine's opening bracket will be highlighted in the Device.c source window.
Examine the EvtDriverDeviceAdd Callback Routine
Now you can start examining the driver code. Here are a few examples:
-
On the WinDbg View menu, click Locals to open a Locals window.
This shows the values of all the local variables.
-
Step past the call to WdfDeviceInitSetPnpPowerEventCallbacks.
-
In the Locals window, expand the pnpPowerCallbacks node.
You will see that three of the callbacks have nonzero values, indicating that they are registered with KMDF and will be called at the appropriate time.
-
Step past the call to WdfDeviceCreate.
You now have a valid device object, one of the key KMDF objects.
-
In the Locals window, expand the device node.
There's no information under the node. The Locals window is of limited use for obtaining information about KMDF objects.
The Locals window does provide one very useful piece of information about the device object: the object handle. It's the hexadecimal value in the variable's Value column. This value is not interesting by itself. However, you can use it with the KMDF debugger extensions to get much more information about the object than is available through the debugger's UI.
Use KMDF Debugger Extensions to Examine the Device Object
You can use the KMDF extensions described in "Debugger Extensions" earlier in this chapter to examine the device object.
To Use KMDF Debugger Extensions to Examine the Device Object
-
If you have not already done so, use the .load command to load the KMDF debugger extensions, as shown in the following example:
-
.load %wdk%\bin\x86\Wdfkd.dll
-
-
To get information about the WDF device object, get the device object's handle from the Locals window and run !wdfdevice, as follows:
-
!wdfdevice ObjectHandle [Flags]
-
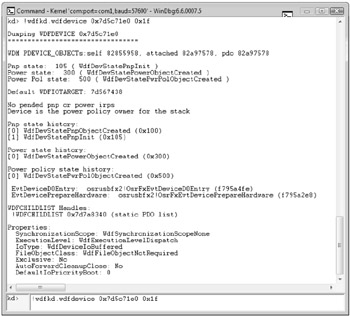
The Flags argument controls what information appears. Figure 22-6 shows the results of running !wdfdevice against the Fx2 device object with a flag argument of 0x1F. This flag value sets all the available flag bits and produces the most verbose output.

Figure 22-6: Output of the !wdfdevice debugger extension for Osrusbfx2
Tip See the !wdfdevice reference page in the Debugging Tools for Windows help file for more information on flag values.
The !wdfdevice command lists a large amount of information about the device object, including information about its Plug and Play and power state and several object properties such as synchronization scope. Figure 22-6 shows the output of the !wdfdevice debugger extension for the Osrusbfx2 sample.
Use KMDF Debugger Extensions to Examine an I/O Request
The steps in this section provide an example of how to use the KMDF debugger extensions to examine how the Osrusbfx2 sample driver handles an I/O request.
To See How the Driver Handles I/O
-
Set a breakpoint in the driver's EvtIoDeviceControl callback routine.
In Osrusbfx2, the routine is named OsrFxEvtIoDeviceControl and is located in Ioctl.c. Device I/O control (IOCTL) requests are used to control several aspects of the device, including the light bar.
-
Run the g command to restart the target computer.
-
On the test computer, start the KMDF test application and have it turn on one or more of the lights on the light bar.
The framework calls OsrFxEvtIoDeviceControl to deliver the IOCTL request to the driver, which breaks into the debugger at the start of the routine.
-
Run the !wdfrequest debugger extension against the request object's handle to examine the incoming request object.
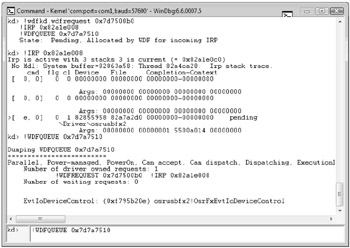
The top part of Figure 22-7 shows the output of the !wdfrequest command for Osrusbfx2.

Figure 22-7: Output from the !wdfrequest debugger extension for Osrusbfx2
The amount of information that !wdfrequest displays about the object is limited, but the output also includes two strings that contain complete command lines for !IRP and !WDFQUEUE:
-
!IRP is a standard debugger extension that displays information about the IRP that underlies the WDFREQUEST object.
-
!WDFQUEUE is a WDF debugger extension that displays information about a specified I/O queue.
Many KMDF debugger extensions display strings with suggested commands that simplify the process of displaying related information. For example, without the !IRP string, you would first be required to spend time determining the address of the IRP before you could run the !IRP command. The simplest way to run the commands is to use the cursor to copy the string from the upper pane to the lower pane and then run the command.
The lower part of the upper pane shown in Figure 22-7 displays the output from the two suggested command lines.
EAN: 2147483647
Pages: 224