WORKING WITH GRAPHS
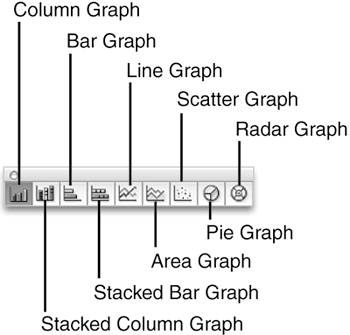
| Illustrator's graph tools enable you to create a number of different types of graphs (see Figure 22.6). The graphs you create here are superior to those you can create in common spreadsheet applications, because the graphic file formats supported by Illustrator reproduce more accurately when you place them in your page layout application. Figure 22.6. You can create nine different types of graphs with Illustrator, depending on the tool you use to define the graph area.
Illustrator offers the tools to create nine different types of graphs: column graphs, stacked column graphs, bar graphs, stacked bar graphs, line graphs, area graphs, scatter graphs, pie graphs, and radar graphs. To create a graph, select one of the graph tools and then click and drag with it on the artboard to define the graph area. This is the area that contains the graph itself; the graph legend and the labels for the graph may extend outside the area you draw. After you draw a frame for your graph, the Graph Data window opens. You can copy and paste graph data from an application like Excel, import it as tab-separated text from a word-processing program, or enter it yourself. Different types of graphs require different types of information. The following sections give you a brief overview of entering data for each type of graph. Setting Up Your Graph and Graph LabelsFirst, here are some tips for creating your graph labels (see Figure 22.7):
Figure 22.7. Graph labels are created based on where you enter the graph information in the Graph Data window.
Next, enter the graph data. Again, you can enter the data in the fields, or copy and paste it from a spreadsheet application. To import data formatted as tab-separated text, click the Import button on the Graph Data window. Browse to the file, select it and click Open. The data you import should be straight numbers and decimals only; do not import numbers that contain commas, for example. Entering Data for Column, Stacked Column, Bar, Stacked Bar, Line, Area, and Radar GraphsThe column, stacked column, bar, stacked bar, line, area, and radar graphs all track changes in information along axes. For column, stacked column, bar, and stacked bar graphs, enter the information you are tracking in a single data column. Each entry creates a separate column in the graph. If you create more than one data column, another column is displayed in the graph; these types of graphs compare information (see Figure 22.8). Figure 22.8. If you enter a single column of graph data in the window, each row creates a separate column or bar in the graph. Two columns of information create two columns or bars for each category.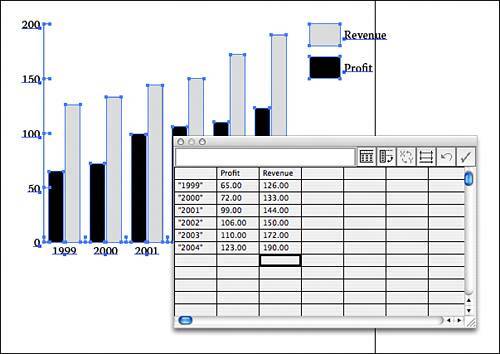 For line graphs, each data column represents a different line in the graph. Area graphs do the same, but each subsequent data column is added to the one before. And for radar graphs, each column creates a line that is tracked around the circle. Entering Data for Scatter GraphsScatter graphs are different; there are no categories of data; they simply compare sets of data along x and y axes. To enter data, first create labels for the sets of data you are comparing. Enter the first label in the first cell of the first row and then enter the second label in the third cell of the first row. Continue entering your data set labels in every other cell (see Figure 22.9). Figure 22.9. Create data labels for the two sets of information you are comparing in every other cell of the first line in the Graph Data window.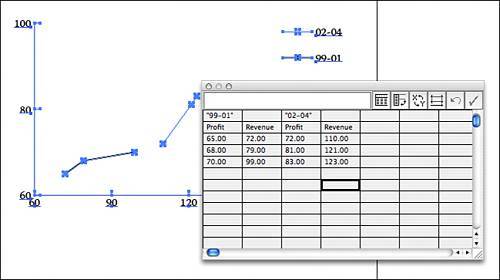 Then, enter the information you want to track along the x axis in the first column and the information you want to track along the y axis in the second column. Continue entering information for all the data sets you are tracking. Entering Data for Pie GraphsPie graphs combine the information entered into a whole. For each row of data you enter, another pie graph is created. To create a single pie graph, you should enter a single row of data. To create a legend that labels the data, enter the categories in the first row of the Graph Data window. Creating GraphsTo generate your graph, click the Apply button on the Graph Data window. The graph is created but the window does not close. Move the window out of the way to make sure your graph looks the way you want and then close it if you're satisfied with how your data is displayed. If you need to change any data, enter the proper information and click Apply again. After your graph is created, you can make any changes to the information. Use the Type tool to select text and change it. Use the Direct Selection tool to select individual parts of the graph to alter them. In addition, you can add effects and color to your graphs. Change the fill and stroke of graph parts to add color or patterns to it, or add drop shadows or transparency. You can even create graphics to serve as columns or bars, making your own infographics. You can find great information in the Adobe Help Center. For more graph inspiration check out the Cool Extras folder in the Illustrator application folder. Open the Sample Files folder and then the Graphs folder (see Figure 22.10). Figure 22.10. The documents in the Graphs folder of Illustrator's Cool Extras give examples of different ways to customize the graphs you create, including graph markers that can be used for infographics.
|


EAN: 2147483647
Pages: 426