The most frequent comment I hear from fellow SAP customers is that they want the ability to extract their own information. It is empowering to know that you can go into SAP and select the data you want and have it come out formatted and sorted in the manner you choose. This section walks you through how to create a basic list report by using the SAP Query tool. The following sections explain all the options on the screens used to create the query report.
1. | Log in to your SAP client where your query reports will be created. (Best practice dictates that they be maintained in your live Production client.)
|
| |
2. | Navigate to the Maintain Queries Initial screen by using the transaction code /nSQ01. Beginning with R/3 release 4.6A, SAP offers a graphical version of the SAP Query tool, called the Graphical Query Painter; if you have not used the SAP Query tool, the Graphical Query Painter is set as your default. To turn off the Graphical Query Painter and learn to create easy step-by-step reports by using the SAP Query tool, select Settings, Settings and then deselect the Graphical Query Painter check box.
|
3. | The title bar lists the query group you are currently in. For example, your title bar might read Query from User Group ZTEST: Initial Screen. If you are assigned to multiple query groups, press F7 to see a list of all of them.
|
4. | As discussed in Chapter 1, "Getting Started with the SAP R/3 Query Reporting Tools," it is recommended that you create your queries in the standard query area. Ensure that you are in the standard query area by selecting Environment, Query Areas and then selecting Standard Area.
|
5. | In the Query field, type DLS_QUERY_01 where DLS is your initials) as the name for the query you are creating, and then click the Create button (see Figure 3.1).
Figure 3.1. The main screen of the SAP Query tool lists all the queries available in the designated query group. 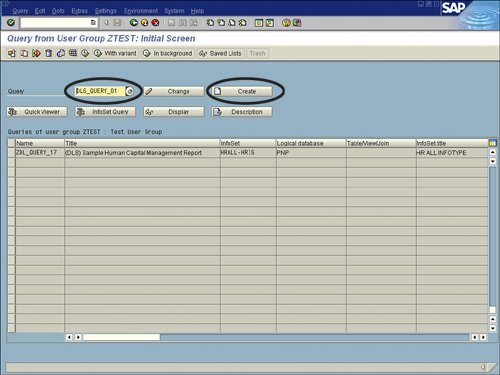
|
6. | The InfoSets of User Group ZTEST window appears, listing all the available InfoSets (that is, data sources) for your query group. Because you created only one (in my example, I called it ZTEST), in Chapter 2, "One-Time Configuration for Query Tool Use," it will be the only one listed. Select the InfoSet you created (ZTEST, in my example) and then click the green check mark button.
|
| |
7. | The Create Query Title Format screen appears. This screen allows you to save the basic formatting specifications for your query, including the name (title) and any notes you want to store for the query. The only required field is the Title (long report description). For this example, fill in only the Title field, as shown in Figure 3.2, and then click Save. (For my example, I used the title (DLS) SAP Query Exercise #01.)
Figure 3.2. The Application toolbar for the SAP Query tool contains navigational arrows that permit you to navigate between the screens of the query. 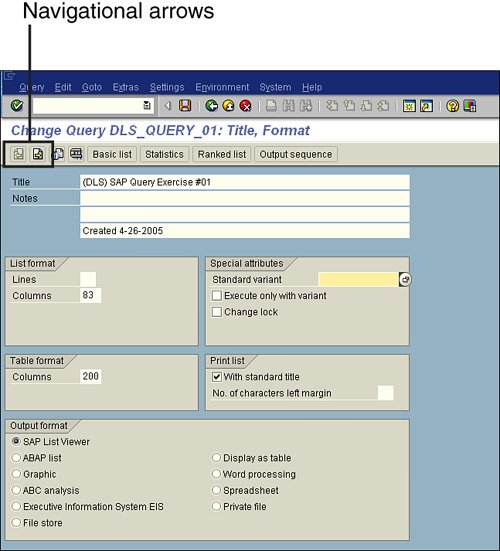
|
| |
8. | Navigate to the next screen in the SAP query creation process by selecting the Next Screen (white navigational arrow) button from the Application toolbar. (You can use the navigational arrows to navigate between the different screens of the SAP Query tool.) The Select Field Group screen appears, listing all the Field groups available within your InfoSet. Figure 3.3 shows this screen with the field groups Flight Schedule [SPFLI], Flight Demo Table [SFLIGHT], and Flight Booking [SBOOK] listed.
Figure 3.3. All the field groups listed at the top right of the InfoSet screen during configuration of the InfoSet are listed on this screen. 
|
9. | Place a check mark next to each field group from which you want to include fields in your report. Navigate to the next screen in the SAP query creation process by selecting the Next Screen (white navigational arrow) button on the Application toolbar. The Select Field screen appears, showing a list of all the available fields in the selected field groups.
|
| |
10. | Place a check mark next to each field that you want to include in your report. You can use the Page Up and Page Down keys to navigate between all the fields (see Figure 3.4). Select the Next Screen (white navigational arrow) button from the Application toolbar to open the Selections screen, which lists all the fields you have selected.
Figure 3.4. All the fields listed in the field groups at the top right of the InfoSet screen during configuration are listed here. 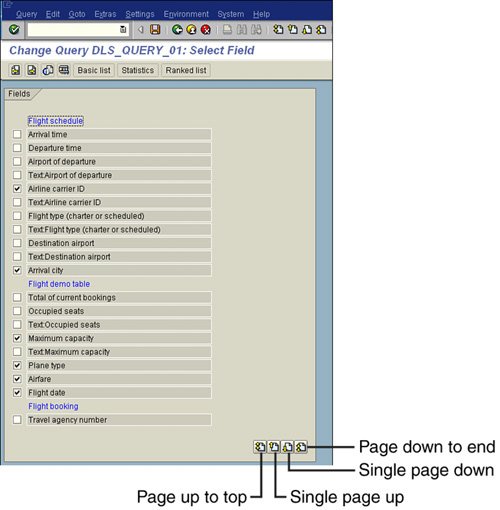
|
| |
11. | If desired, add any of the fields to the selection screen that will be presented when you execute your report. You can add a field to the Selections screen by placing a check mark next to each one (see Figure 3.5).
Figure 3.5. Having fields available on the report's selection screen gives you the ability to specify your report output upon execution. 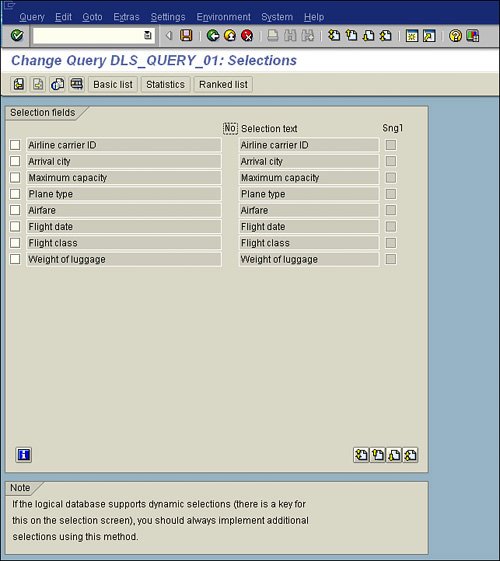
|
12. | Click the Basic List button from the Application toolbar to create an SAP basic list query. The Basic List Line Structure screen appears, showing a list of the fields you selected to include in your report.
|
| |
13. | For each field, specify the line and sequence number as you want them to appear on your report. Also use this screen to indicate sort order, totals, and counts, if needed. Start by entering the line and sequence numbers, like the ones shown in Figure 3.6.
Figure 3.6. Basic output options are defined on the SAP Query tool Basic List Line Structure screen. 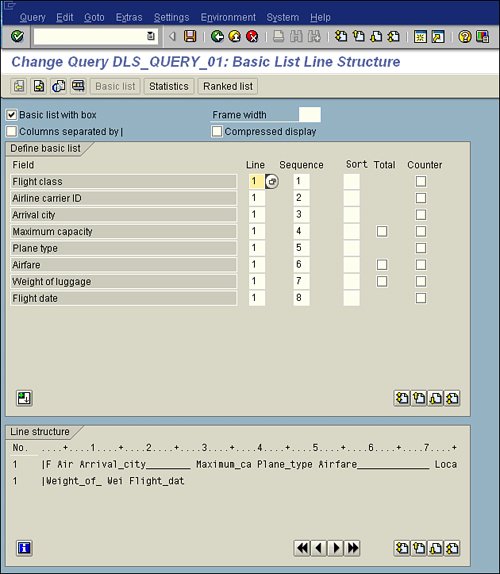
Note You can use Figure 3.6 as follows: - Line column The values in this column correspond to the line numbers the fields will appear on in the report.
- Sequence column The numbers in this column determine the order of the fields for the line.
- Sort column This column dictates the order in which the data will be sorted.
- Line Structure box After you click the Save button, a preview of the format appears in the Line Structure box at the bottom of the screen.
|
14. | For this example, proceed directly to the report by pressing F8, which causes the report to execute.
|
15. | As with almost all other reports in SAP, when you execute this report, you see the report's selection screen. Specify any criteria for the output of your report. Notice that any fields indicated on the Selections screen are included on your selection screen, under the heading Program Selections (see Figure 3.7).
Figure 3.7. Selection screens enable you to further specify report output. 
|
| |
16. | Select the F8 Execute button on your Application toolbar (it looks like a clock) to display your finished report. Your report output appears; it should look similar to what is shown in Figure 3.8. (Keep in mind that the actual values vary by organization: The output of the report corresponds to the specification entered on the Basic List Line Structure screen.)
Figure 3.8. In SAP 4.6 and higher, by default, your report displays in the SAP List Viewer. 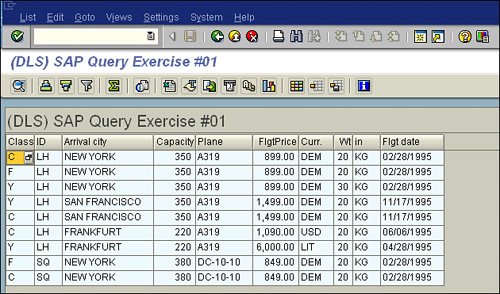
|