Using the Debugger
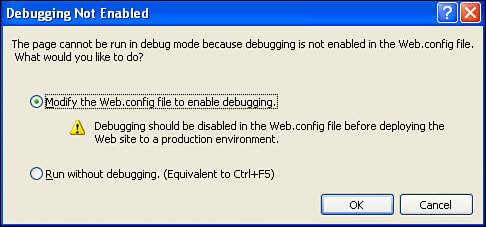
| Over the course of creating ASP.NET pages, you'll undoubtedly run into problems where the page's source code portion isn't behaving as you'd expect. Perhaps a particular block of source code is not running when you expect it to, or the output you're seeing is different than what you'd expect. In such circumstances, your best friend is the debugger. A debugger is a special piece of software that can intercept a running program and provide the programmer a deep level of introspection into the inner workings of the program. Unfortunately, we don't have the time or space to delve into the depths of debugging; instead, we'll just concentrate on some of the more common debugging tasks. To use the debugger when testing an ASP.NET page, you need to go to the Debug menu and choose Start Debugging. If this is the first time you've attempted to debug this particular website, the Debugging Not Enabled dialog box will appear, as shown in Figure 4.12. If you need to debug an ASP.NET website, the site must be configured to support debugging; by default, a new ASP.NET website project is not configured to support debugging. The Debugging Not Enabled dialog box warns you of this and offers to automatically alter the web.config configuration file to enable debugging support. Figure 4.12. The Debugging Not Enabled dialog box warns you that the application is not configured for debugging.
Opt to have the web.config file updated so that the website supports debugging by selecting Modify the Web.config File to Enable Debugging and click the OK button. This will fire up the browser, loading the FinancialCalculator.aspx page, just as in Figure 4.8. At this point you can't even tell that the debugger is running because there's nothing different shown in the browser. The difference is that now you can add one or more breakpoints to your ASP.NET page's source code portion. A breakpoint is a marker in the source code that, when reached, causes the program to halt, letting the debugger take over. When a breakpoint is reached, control automatically reverts to Visual Web Developer, allowing you to step through the execution of the code one line at a time, viewing the value of variables. Let's set a breakpoint. Leave the browser running and return to the FinancialCalculator.aspx page's source code portion in Visual Web Developer. Let's add a breakpoint to the line of code that reads Dim P As Double = loanAmount.Text (line 10 in Listing 4.1). To accomplish this, place your cursor on this line of code and press F9; alternatively, you can click in the light gray, left margin next to this line of code. In either case, a breakpoint will be set, which will display a red circle in the margin and highlight the line of code in red. Figure 4.13 shows the page's source code portion in Visual Web Developer after this breakpoint has been set. Figure 4.13. A breakpoint has been set.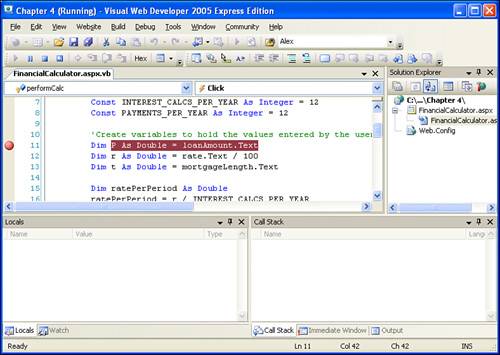 Now return to the browser, enter some values into the text boxes, and click the Compute Monthly Cost button. Clicking the button causes a postback, which returns control to the ASP.NET page's source code portion, invoking the Button's Click event handler to execute. As this execution occurs, eventually the Dim P As Double = loanAmount.Text line of code is reached, where we have our breakpoint. When this line is hit, the program halts and the debugger takes over. In Visual Web Developer, the current line of code being executed is highlighted yellow (see Figure 4.14); this current line of code is the line where we set the breakpoint moments ago. Figure 4.14. The breakpoint has been reached, halting program execution.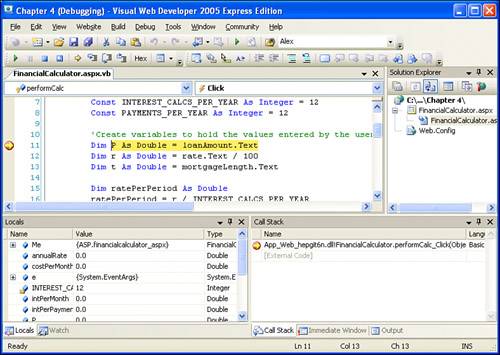 When a breakpoint is hit and program execution is halted, the debugger takes over. From the debugger we can inspect the values of various variables. For example, in the lower-left corner of Figure 4.14, you'll find the Locals window, which shows all of the current variables and their values. Many of these variables have their default values. For example, the variables annualRate, costPerMonth, intPerMonth, and so on all have values of 0. The reason is that we've yet to reach the lines of code where these variables are assigned a value. As we step through the executing program, these values in the Locals window will be updated accordingly. To progress the flow of the program's execution, go to the Debug menu and choose Step Over, or simply press F10. This will move you to the next line of code. Press F10 a couple of times and note how the yellow highlighted line moves further down the lines of code, updating the values in the Locals window. If you want to run until the next breakpoint, press F5, or go to the Debug menu and choose Continue. Doing so in our example will return control to the browser because no more breakpoints will be reached.
To stop debugging altogether, go to the Debug menu and choose Stop Debugging. The preceding explanation is but a brief overview of the debugging capabilities offered by Visual Web Developer. Before you explore Visual Web Developer's debugging capabilities in more detail, I first encourage you to become more familiar with creating ASP.NET web pages. When you're ready, however, you can learn more about the debugging process at Microsoft's Walkthrough: Debugging Web Pages in Visual Web Developer, available online at http://msdn2.microsoft.com/en-us/library/z9e7w6cs. |
EAN: 2147483647
Pages: 233