1.3 The project office
1.3 The project office
The project office (PO) is an organizational entity chartered with supporting the work through projects. The extent of the PO support can range from serving as repositories of information regarding project-management best practices to being fully responsible for an organization's projects and programs.
The Gartner Group [5] defines three possible roles for the PO:
-
The PO as repository: At its most basic level the PO serves as the custodian for the project-management processes and as a repository for best practices. In this conception the PO is not formally involved in decisions concerning project execution; such decisions remain under the umbrella of the sponsoring functional areas.
-
The PO as coach: In its second organizational form, the PO takes a more active role. It provides guidance to project managers and participates in project reviews when called upon. The PO staff has a hand in the startup and closure of projects and provides expertise in specialized areas such as risk management and cost estimation when required. The PO performs some monitoring and consolidation of project performance reports, but does not order corrective action.
-
The PO as manager: In this role, the PO operates as an agent of senior management, which authorizes the PO to manage the project portfolio in its behalf. In addition to the responsibilities defined for the two previous roles, the PO is responsible for preparing a master plan and a resource plan reflecting the work the organization is committed to in the midterm, for reviewing project proposals, and for monitoring the execution of the portfolio.
Other organizations, such as the Dorsey Company [6], have produced similar classifications. Dorsey refers to them as project support office, project/program office, and project governance office. Table 1.2 summarizes the different types of POs.
| Repository | Coach | Manager |
|---|---|---|
| | ||
| Custodian of the organization's project-management processes (methods and tools) | Provides mentoring and coaching to project managers | Ensures alignment of projects and business strategy |
The different types of POs must not be confused with maturity levels or stages of institutional development. An organization with a manager type of PO is not necessarily better or more mature than one deploying a repository type of PO. The different types reflect different organizational needs, cultures, and governance realities.
This book develops on the idea of the PO as manager. Those who need a less powerful type of implementation could use the responsibility matrix described in Chapter 3 (see Table 3.1) to tailor-down proposals to the needs of their organizations.
1.3.1 Making the case for the PO
Although the decision to deploy a PO in a given organization needs to be made on a case-by-case basis, it is possible to examine what is at stake by looking at the research and development (R&D) expenditures reported by several well-known companies. The reason for choosing R&D expenditures to exemplify the potential savings and gains that could be realized through a PO is threefold: First, the numbers are publicly available in the annual reports of the companies. Second, most R&D work adopts the form of projects. Third, R&D organizations exhibit most of the problems we will be referring to throughout this book.
Table 1.3 shows the annual savings that could be realized by these companies, should the implementation of a PO bring a lasting improvement of 1%, 5%, and 10% of their operations. The savings likely to be brought by the implementation of a PO are the result of a better coordination of resources, consistent decision making across projects, and risk sharing among all of the projects in the portfolio.
| Company | Industry | R&D Expenses for 2000 (in millions of dollars) | Assuming Operations Improve by[*] | ||
|---|---|---|---|---|---|
| | |||||
| 1% | 5% | 10% | |||
| Ericsson | Communication equipment | 4,014 | 40 | 200 | 401 |
| Nortel | Communication equipment | 4,005 | 40 | 200 | 400 |
| Microsoft | Software | 3,772 | 37 | 188 | 377 |
| Merck | Pharmaceutical | 2,343 | 23 | 117 | 234 |
| Novartis | Pharmaceutical | 1,984 | 19 | 99 | 198 |
| Oracle | Software | 1,000 | 10 | 50 | 100 |
| J.D. Edwards | Software | 116 | 1.1 | 5.8 | 11.6 |
| Rational Corp. | Software | 102 | 1 | 5.1 | 10.2 |
| Ballard Power | Fuel cells | 55 | .5 | 2.8 | 5.5 |
| Cognos | Software | 54 | .5 | 2.7 | 5.4 |
| Borland | Software | 42 | .4 | 2.1 | 4.2 |
| Activision | Entertainment | 26 | .26 | 1.3 | 2.6 |
| Eaglepoint | Software | 3 | 0 | .15 | .3 |
|
[*]Results in savings in millions of dollars per year. | |||||
For those who think that it is not possible to realize savings of these magnitudes simply by improving the project-management function, the charts in Figure 1.5 should suffice to show the influence that project management can exert over development costs. The first chart in the figure shows development costs attributed to managerial factors in a study of R&D work in the pharmaceutical industry; the second one shows the waste incurred in the information technology sector based on a study by the Standish Group, and the third the effort wasted by organizations according to their portfolio-management practices in a study conducted by the firm PRTM.
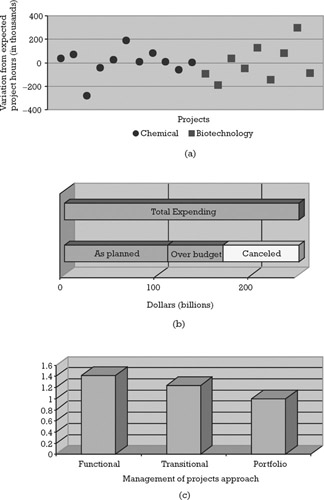
Figure 1.5: Effects of project management on development costs. (a) Management influence on cost: The y-axis shows the difference between the actual and the expected hours spent in the development of new pharmaceutical products after discounting project complexity, production scale, and therapeutic class. (b) Waste on IT projects: Almost one-third of the total spending, billions, never comes to fruition. (c) Organizations where projects are executed in functional silos waste, on average, 42% more effort than organizations that use the portfolios approach owing to inconsistent decision making concerning the termination of failed projects. (After: [7–9])
But POs are not just about cutting costs and creating shareholder value. The PO can also have an impact on the quality of life of employees working in R&D environments.
The 1990s was a decade of change. Companies were making money despite themselves. At the height of the dot-com fever, being first to market was the be-all and end-all, and performance targets were set with little or no connection to organizational capacity; as a consequence, work–life conflicts increased markedly [10]. Employees were, and still are, putting in longer hours at work and experiencing greater challenges in balancing their roles as employee, parent, spouse, and community member. As Figure 1.6 shows, workers have become more stressed and physical and mental health has declined, along with personal satisfaction.
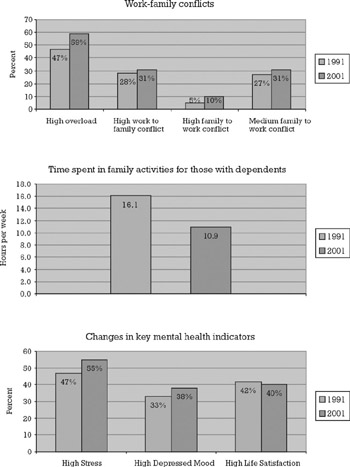
Figure 1.6: Quality-of-life indicators, 1991 versus 2001. (After: [10].)
It is undoubtedly essential that a corporation have a healthy bottom line—after all, its employees' jobs depend on it—but must a healthy bottom line come at the expense of employee quality of life? Furthermore, when an employee is putting in 60 hours a week, week after week, is he or she really making a valuable contribution? Is it sustainable? Are we really doing more, or only spending more time at work? The model depicted in Figure 1.7 and the statistics in Table 1.4 show the negative consequences of work and family stress.
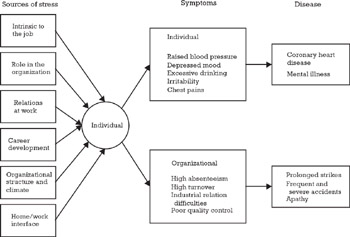
Figure 1.7: Dynamics of work stress. (After: [11].)
| Consequence | Type and degreet of conflict | |||||
|---|---|---|---|---|---|---|
| Role Overload[1] | Work To Family[2] | Family To Work[3] | ||||
| High | Low | High | Low | High | Low | |
| Lack of organizational commitment (%) | 53 | 42 | 58 | 39 | ||
| Lack of job satisfaction (%) | 70 | 40 | 80 | 40 | 67 | 46 |
| High job stress (%) | 44 | 2 | 57 | 9 | 20 | 40 |
| High employee turnover. Think of leaving weekly. (%) | 18 | 7 | 26 | 7 | 20 | 7 |
| Missed work time due to family (%) | 54 | 37 | 55 | 45 | 75 | 42 |
| Absenteeism due to: | ||||||
| Health problem (%) | 54 | 41 | 54 | 47 | 60 | 46 |
| Family problem (%) | 29 | 12 | 28 | 20 | 55 | 10 |
| Mental health day (%) | 39 | 18 | 40 | 26 | 40 | 28 |
| Average number of days absent in six months due to: | ||||||
| Health problem (days) | 3.7 | 2.7 | 3.5 | 3.0 | 4.0 | 3.0 |
| Childcare problem (days) | 0.7 | 0.3 | 0.6 | 0.4 | 1.6 | 0.3 |
| Eldercare problem (days) | 0.3 | 0.2 | 0.7 | 0.3 | 0.5 | 0.3 |
| Mental health day (days) | 0.9 | 0.2 | 0.9 | 0.2 | 1.0 | 0.2 |
| Total (days) | 5.6 | 3.4 | 5.7 | 3.9 | 7.1 | 4.2 |
| Rate organization as above average place to work (%) | 48 | 75 | 39 | 72 | 48 | 60 |
| Rate organization as below average place to work (%) | 13 | 4 | 19 | 4 | 12 | 9 |
| Use EAP/psychological counseling (%) | 75 | 5 | 35 | 24 | 35 | 8 |
| Purchased prescription medicine (%) | 65 | 54 | ||||
|
[1]Role overload exist when the total demand on the time and energy associated with a person's responsibilities in different roles, such as parent, community member, employee, are too great to perform the roles adequately or comfortably.
[2]Work-to-family conflict occurs when work demands make it more difficult to fulfill family responsibilities.
[3]Family-to-work conflict occurs when family responsibilities make it more difficult to fulfill work responsibilities. | ||||||
As will be shown in later chapters, by bringing the organizational workload under control and eliminating the need for constant fire fighting, the PO can positively affect individual—and corporate—well-being.
1.3.2 Obstacles to successful deployment
To be successful, the deployment of a PO must be done in accordance with the culture, requirements, and governance realities of the organization. This is unmistakably indicated by the disparity of the responses given in a survey [11] inquiring about the main obstacles facing the deployment of a PO in three Swedish companies. Although most of the respondents agreed that having a managerial PO could be a solution to their multiproject problems (see Figure 1.8), they perceived very different obstacles as potential hindrances to such an entity's successful deployment (see Figure 1.9). This disparity is probably a reflection of the experience, career interests, and position of the respondents within their respective organizations.
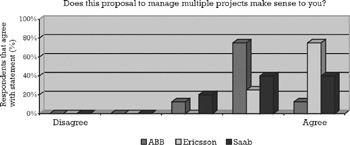
Figure 1.8: Survey results showing positive perception of PO concept. (Source: [12].)
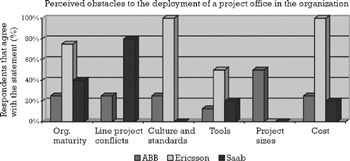
Figure 1.9: Perceived obstacles to PO deployment. (Source: [12].)
A successful implementation must thus begin with an assessment of an organization's current situation and the adaptation of any generic model, like the one proposed in this book, to the realities of the organization.
EAN: 2147483647
Pages: 81