Section 10.2. How to Forecast Improvement
| |
10.2 How to Forecast Improvement
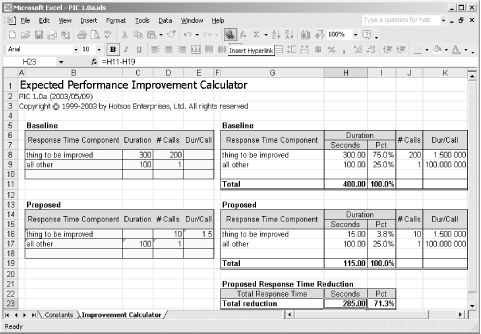
One of the nicest things about the resource profile format is the ease with which you can predict the impact of a proposed improvement activity. Figure 10-2 shows a simple Microsoft Excel workbook that you can use to accomplish this task.
Figure 10-2. A simple performance improvement calculator that shows the expected response time benefit of reducing the number of calls of some "thing to be improved" from 200 calls to 10 calls

In the workbook shown here, I have specified in my Baseline case that a component called "thing to be improved" presently consumes 300 seconds of duration and is called 200 times. Another response time component called "all other" accounts for 100 seconds of total duration and is called only once.
|
In columns G through K, the workbook formats my input data into a full resource profile format.
In my Proposed case, I have specified that I think I can eliminate all but 10 of the calls to "thing to be improved." In cell E16, I have used the formula =K8 to denote that I believe my per-call latency will remain the same. In columns G through K, the workbook formats my Proposed case input data and produces a response time reduction summary. If I really can reduce the number of calls to "thing to be improved" from 200 to 10, then I should expect to see a response time improvement of about 285 seconds for this user action, or an elimination of about 71% of its response time.
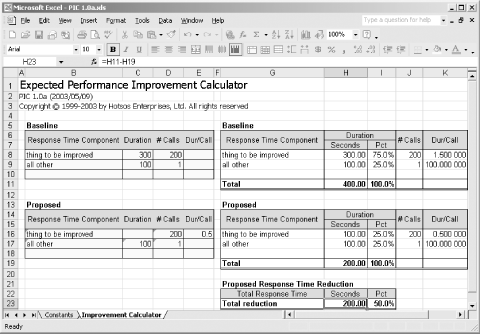
Excel is a good tool for analyses like this one, because it allows you to see quickly "what if" you were to try a given performance improvement activity. For example, which is better, to reduce the call count for "thing to be improved" from 200 to 10? Or to reduce the per-call latency from 1.5 seconds to 0.5 seconds? Figure 10-3 shows that the better answer in this case is to reduce the call count. Of course, you could also use the tool to determine the impact of implementing both performance improvement activities.
|
Figure 10-3. The performance improvement calculator shows plainly that reducing the duration per call from 1.5 sec/call to 0.5 sec/call for some "thing to be improved" can be expected to deliver less response time benefit than the benefit shown in Figure 10-2

| |
| Top |
EAN: 2147483647
Pages: 102
- Linking the IT Balanced Scorecard to the Business Objectives at a Major Canadian Financial Group
- A View on Knowledge Management: Utilizing a Balanced Scorecard Methodology for Analyzing Knowledge Metrics
- Measuring ROI in E-Commerce Applications: Analysis to Action
- The Evolution of IT Governance at NB Power
- Governance Structures for IT in the Health Care Industry
