Section 5.3. Response Time Accounting
| |
5.3 Response Time Accounting
The Oracle kernel emits two categories of time into a trace file:
-
Time consumed within a database call
-
Time consumed between database calls
A session's total response time is the sum of all time spent within database calls, plus the sum of all time consumed between database calls. To keep from over- or under-accounting for response time in your trace file, you must know the proper category for each line of your trace file.
5.3.1 Time Within a Database Call
The trace file excerpt in Example 5-3 shows actions that consume time within three different database calls. The first database call to complete was a parse call that consumed 306 m s. The kernel helpfully supplied the PARSING IN CURSOR section before emitting the PARSE line so that you and I can tell what got parsed. Next , the kernel emitted an EXEC line, which means that an execute call completed upon the cursor, consuming an additional 146 m s of elapsed time. The next actions to complete are two operating system read calls denoted on the two WAIT lines. The "parent" operation responsible for issuing these read calls is the fetch call whose statistics are reported on the FETCH line.
Example 5-3. This trace file excerpt demonstrates the consumption of time within three database calls
= = = = = = = = = = = = = = = = = = = = = PARSING IN CURSOR #4 len=132 dep=1 uid=0 oct=3 lid=0 tim=1033064137929238 hv=3111103299 ad='517ba4d8' select /*+ index(idl_ub1$ i_idl_ub11) +*/ piece#,length,piece from idl_ub1$ where obj#=:1 and part=:2 and version=:3 order by piece# END OF STMT PARSE #4:c=0,e=306,p=0,cr=0,cu=0,mis=0,r=0,dep=1,og=4,tim=1033064137929139 EXEC #4:c=0,e=146,p=0,cr=0,cu=0,mis=0,r=0,dep=1,og=4,tim=1033064137931262 [1] WAIT #4 nam='db file sequential read' ela= 13060 p1=1 p2=53903 p3=1 [2] WAIT #4 nam='db file sequential read' ela= 6978 p1=1 p2=4726 p3=1 [3] FETCH #4: c=0,e=21340,p=2,cr=3,cu=0,mis=0,r=0,dep=1,og=4,tim=1033064137953092 STAT #4 id=1 cnt=0 pid=0 pos=0 obj=72 op='TABLE ACCESS BY INDEX ROWID IDL_UB1$ ' STAT #4 id=2 cnt=0 pid=1 pos=1 obj=120 op='INDEX RANGE SCAN '
The lines for the read calls occur in the trace data before the line for the fetch that motivated them because the Oracle kernel emits the statistics for an action upon that action's completion. The Oracle kernel instructions that produced these trace lines looked something like this:
fetch IDL_UBL$ query execute some of the instructions necessary for the IDL_UBL$ fetch perform a single-block I/O call upon file 1, block 53903 emit [1] "WAIT #4: nam='db file sequential read' ela=13060 ..." execute some more fetch instructions perform a single-block I/O call upon file 1, block 4726 emit [2] "WAIT #4: nam='db file sequential read' ela=6978 ..." execute the remainder of the fetch instructions emit [3] "FETCH #4:c=0,e=21340,..." close the cursor etc.
The fetch call consumed a total elapsed duration of 21,340 m s. The components of the response time for the fetch call are shown in Table 5-5.
Table 5-5. Components of the fetch call response time
| Response time | Component |
|---|---|
| 13,060 m s | db file sequential read |
| 6,978 m s | db file sequential read |
| m s | Total CPU |
| 1,302 m s | Unaccounted for |
| 21,340 m s | Total elapsed time for the fetch |
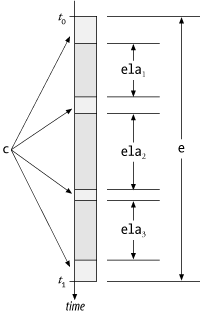
The e statistic for a database call is the elapsed duration of the entire database call. Thus, the value of e includes the duration of all CPU time consumed by the call (reported as the value of c ), plus all of the elapsed time consumed by wait events executed in the context of the database call (reported as ela values). Figure 5-1 shows the relationship; formally , we write:
![]()
This is the fundamental relationship of Oracle time statistics within a single database call. The relationship is only approximate because of factors including measurement intrusion effect, quantization error, time spent not executing, and un-instrumented Oracle kernel code segments, which I discuss in Chapter 7.
Figure 5-1. The fundamental relationship of Oracle time statistics within a single database call: the total elapsed duration (e) approximately equals the total CPU time for the call (c) plus the sum of the durations of its wait events ( S ela)
5.3.2 Time Between Database Calls
The Oracle kernel also emits elapsed durations for wait events that occur between database calls. Examples of wait events that occur between database calls include:
- SQL*Net message from client
- SQL*Net message to client
- single-task message
- pipe get
- rdbms ipc message
- pmon timer
- smon timer
The trace file excerpt in Example 5-4 shows wait events that occur between database calls. The application depicted here makes the scalability-inhibiting mistake of parsing too often. As you can see, the excerpt shows two consecutive parse calls (bold) of the exact same SQL text. The WAIT lines (bold and italic) occur between the parse calls both in the sense of where they are located in the trace file and also because the elapsed times of these actions are not tallied into the elapsed time of the second parse call. You can confirm this by noticing that the elapsed duration recorded for the second PARSE line ( e=0 ) is too small to contain the elapsed duration for the SQL*Net message from client event ( ela= 3 ).
Example 5-4. This trace file excerpt demonstrates the consumption of time between two identical parse calls on an Oracle8i system
= = = = = = = = = = = = = = = = = = = = = PARSING IN CURSOR #9 len=360 dep=0 uid=26 oct=2 lid=26 tim=1716466757 hv=2475520707 ad='d4c55480' INSERT INTO STAGING_AREA (TMSP_LAST_UPDT, OBJECT_RESULT, USER_LAST_UPDT, DOC_OBJ_ID, TRADE_NAME_ID, LANGUAGE_CODE) values(TO_DATE('11/05/2001 16:39:06', 'MM/DD/YYYY HH24:MI: SS'), 'if ( exists ( stdphrase ( "PCP_MAV_1" ) ) , langconv ( "Incompatibility With Other Materials" ) + ": " , log_omission ( "Materials to Avoid: " ) )', 'sa', 222, 54213, 'NO_ LANG') END OF STMT PARSE #9:c=0,e=0,p=0,cr=0,cu=0,mis=1,r=0,dep=0,og=4,tim=1716466757 WAIT #9: nam='SQL*Net message to client' ela= 0 p1=1413697536 p2=1 p3=0 WAIT #9: nam='SQL*Net message from client' ela= 3 p1=1413697536 p2=1 p3=0 = = = = = = = = = = = = = = = = = = = = = PARSING IN CURSOR #9 len=360 dep=0 uid=26 oct=2 lid=26 tim=1716466760 hv=2475520707 ad='d4c55480' INSERT INTO STAGING_AREA (TMSP_LAST_UPDT, OBJECT_RESULT, USER_LAST_UPDT, DOC_OBJ_ID, TRADE_NAME_ID, LANGUAGE_CODE) values(TO_DATE('11/05/2001 16:39:06', 'MM/DD/YYYY HH24:MI: SS'), 'if ( exists ( stdphrase ( "PCP_MAV_1" ) ) , langconv ( "Incompatibility With Other Materials" ) + ": " , log_omission ( "Materials to Avoid: " ) )', 'sa', 222, 54213, 'NO_ LANG') END OF STMT PARSE #9:c=0,e=0,p=0,cr=0,cu=0,mis=0,r=0,dep=0,og=4,tim=1716466760 With this knowledge, you can refine your understanding of the relationship among c , e , and ela statistics for an entire trace file. Given what you've seen so far, total response time for a session equals the total amount of time spent within database calls, plus the total amount of time spent between database calls. We can state this formally as:
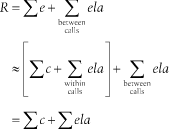
However, there is one final complication: the double-counting imposed by the presence of recursive SQL.
5.3.3 Recursive SQL Double-Counting
Recursive SQL is the SQL associated with any database call that has a dep value that is greater than zero. A dep= n + 1 database call (for n = 0, 1, 2, ...) can be regarded as a child of some dep= n database call. Application sessions routinely produce complicated enough trace data to produce a whole forest of relationships among SQL statements that act as each other's parents, children, siblings, and so on. Each SQL trace file contains enough information to enable you to determine the exact parent-child relationships among database calls. To account for a session's response time without double-counting some statistics, you must understand how to determine the recursive relationships among database calls.
5.3.3.1 Parent-child relationships
The term recursive denotes the Oracle kernel's execution of database calls within the context of other database calls. Activities that inspire recursive SQL include execution of DDL statements, execution of PL/SQL blocks with DML statements within them, database call actions with triggers on them, and all sorts of routine application DML statements that motivate data dictionary access. Any database call that can execute another database call can motivate recursive SQL.
Example 5-5 is a trace file excerpt that contains evidence of recursive SQL in action. In this excerpt, you can see information about a new cursor labeled #2 , which is associated with the following SQL text:
select text from view$ where rowid=:1
This SQL text appears nowhere within the source of the application that was traced. This SQL was motivated by the parse of a query from the DBA_OBJECTS view.
Example 5-5. A trace file excerpt containing evidence of recursive SQL. The three cursor #2 actions at dep=1 are recursive children of the dep=0 parse action upon cursor #1
= = = = = = = = = = = = = = = = = = = = = [1] PARSING IN CURSOR #2 len=37 dep=1 uid=0 oct=3 lid=0 tim=1033174180230513 hv=1966425544 ad='514bb478' select text from view$ where rowid=:1 END OF STMT [2] PARSE #2:c=0,e=107,p=0,cr=0,cu=0,mis=0,r=0, dep=1 ,og=4,tim=1033174180230481 [3] BINDS #2: bind 0: dty=11 mxl=16(16) mal=00 scl=00 pre=00 oacflg=18 oacfl2=1 size=16 offset=0 bfp=0a22c34c bln=16 avl=16 flg=05 value=00000AB8.0000.0001 [4] EXEC #2:c=0,e=176,p=0,cr=0,cu=0,mis=0,r=0, dep=1 ,og=4,tim=1033174180230878 [5] ETCH #2:c=0,e=89,p=0,cr=2,cu=0,mis=0,r=1, dep=1 ,og=4,tim=1033174180231021 [6] TAT #2 id=1 cnt=1 pid=0 pos=0 obj=62 op='TABLE ACCESS BY USER ROWID VIEW$ ' = = = = = = = = = = = = = = = = = = = = = [7] PARSING IN CURSOR #1 len=85 dep=0 uid=5 oct=3 lid=5 tim=1033174180244680 hv=1205236555 ad='50cafbec' select object_id, object_type, owner, object_name from dba_objects where object_id=:v END OF STMT [8] PARSE #1:c=10000,e=15073,p=0,cr=2,cu=0,mis=1,r=0, dep=0 ,og=0,tim=1033174180244662
The rule for determining the recursive relationships among database calls is simple:
A database call with dep= n + 1 is the recursive child of the first subsequent dep= n database call listed in the SQL trace data stream.
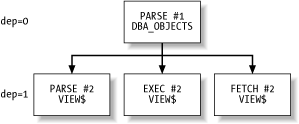
Example 5-6 shows by example why this is true. The Oracle kernel can emit trace data for a database call only after the action has completed. (The kernel cannot compute, for example, the call's elapsed time until after the call has completed.) Thus we can reconstruct the sequence of instructions that generated the SQL trace data shown in Example 5-5. Specifically, in this example, all the database calls for the VIEW$ query are recursive children of the parse call for the DBA_OBJECTS query. The indentation levels for procedures in the call stack shown in Example 5-6 highlight the recursive parent-child relationship among database calls.
Example 5-6. This sequence of Oracle kernel instructions emits SQL trace data in the order shown in Example 5-5. In this listing, indentation is proportional to call stack depth
parse DBA_OBJECTS query # query VIEW$ to obtain the definition of DBA_OBJECTS parse VIEW$ query # execute the instructions necessary for the VIEW$ parse emit [1] "PARSING IN CURSOR #2 ..." emit [2] "PARSE #2: ..." bind to the VIEW$ cursor # execute the instructions necessary for the VIEW$ bind emit [3] "BINDS #2: ..." execute the VIEW$ cursor # execute the instructions necessary for the VIEW$ exec emit [4] "EXEC #2: ..." fetch from the VIEW$ cursor # execute the instructions necessary for the VIEW$ fetch emit [5] "FETCH #2: ..." close the VIEW$ cursor # execute the instructions necessary for the VIEW$ close emit [6] "STAT #2: ..." # execute the remaining instructions for the DBA_OBJECTS parse emit [7] "PARSING IN CURSOR #1 ..." emit [8] "PARSE #1: ..."
Figure 5-2 shows a graphical representation of the parent-child relationships among the database calls.
Figure 5-2. The recursive call stack for Example 5-5 expressed graphically
5.3.3.2 Recursive statistics
In Oracle releases through at least Oracle9 i Release 2, a database call's c , e , p , cr , and cu statistics contain an aggregation of the resources consumed by the database call itself and its entire recursive progeny.
|
Figure 5-3 illustrates such a relationship for a fictional set of database calls. Each node (rectangle) in the graph represents a database call (e.g., a PARSE , EXEC , or FETCH ). A directed line from some node A to another node B denotes that database call A is a recursive parent (that is, the caller ) of database call B . The cr= n listed inside the node is the statistic that the Oracle kernel will emit for the database call. The value of cr self is the number of consistent-mode reads executed by the database call itself, exclusive of its children's call counts.
Figure 5-3. Each of a database call's c, e, p, cr, and cu statistics is an aggregation of consumption on that statistic for that database call's entire recursive family tree
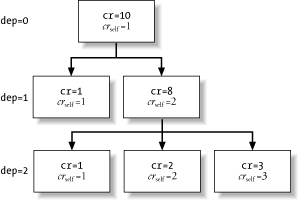
The kernel emits only the progeny-inclusive statistics, but from these statistics you can derive the progeny-exclusive statistics shown inside the nodes. For example, if the numbers inside the nodes in Figure 5-3 had been omitted, it would be easy to fill them in. Each node's value is simply the statistic value for that node minus the sum of the statistic values reported for that node's direct descendants. The value of a node at dep= k is thus the cr value reported for that database call minus the sum of the cr values of its dep= k + 1 descendants. Or, to generalize, we can say that the quantity s of a resource consumed by a database call at dep= k is:
![]()
where s i is the value of a statistic in the set { c , e , p , cr , cu } reported by the Oracle kernel at recursive depth i .
You can use this technique easily enough on real trace data. Again consider the database calls described in Example 5-5. Figure 5-4 illustrates the progeny-inclusive elapsed time value for each database call (denoted e ) and the progeny-exclusive elapsed time contribution for each database call (denoted e self ).
Figure 5-4. The recursive call stack for Example 5-5 expressed graphically
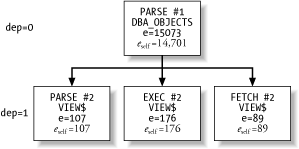
Table 5-6 shows all the progeny-exclusive statistics associated with each database call in Example 5-5. The progeny-exclusive contribution to elapsed time for the PARSE #1 database call, for example, is:

Table 5-6. The c, e, p, cr, and cu statistics for a cursor include that cursor's activity by itself plus the activity of all of its recursive children. You can derive a cursor's individual activity by using subtraction
| Resources consumed by... | c | e | p | cr | cu |
|---|---|---|---|---|---|
| PARSE #1 , including its recursive progeny | 10,000 | 15,073 |
| 2 |
|
| PARSE #2 , a child |
| 107 |
|
|
|
| EXEC #2 , a child |
| 176 |
|
|
|
| FETCH #2 , a child |
| 89 |
| 2 |
|
| PARSE #1 excluding its recursive progeny | 10,000 | 14,701 |
|
|
|
Now we have enough information to complete the response time accounting formula. When we eliminate the double-counting influences of recursive SQL, we have, finally:
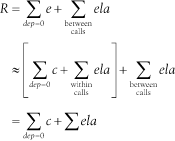
That is, the total response time for a trace file approximately equals the sum of the file's e values for database calls at recursive depth zero, plus the sum of the file's ela values for wait events that occur between database calls. A file's total response time approximately equals the sum of the file's c values for database calls at depth zero, plus the sum of all the file's ela values.
| |
| Top |
EAN: 2147483647
Pages: 102
