Creating the Right Chart for the Job
|
| < Day Day Up > |
|
Making sure you've got the right chart for the data you're displaying is key to communicating your point most effectively. Some charts, such as bar and column charts, are best for comparing data items—for example, tracking the sales of apples compared to oranges. Other charts, such as pie charts, are better for showing the relation of individual items to a whole—such as the sales of apples and oranges as they compare to total produce sold in May 2004.
| Tip | Create your own custom chart types You can also create your own custom chart types with Graph. When there's a specific type of chart you want, or a mix of chart types, you can create your own specifications and save them with the current document. To find out more about creating a custom chart type, see "Creating Your Own Chart Types,". |
Checking Out the Chart Types
Graph makes it simple for you to select and change chart types. Start by creating a new chart or by displaying the chart you've already created. Double-click the chart, if necessary, so that the Graph additions to the Standard toolbar are displayed. Then choose Chart, Chart Type. The Chart Type dialog box appears, as shown in Figure 14-3, containing all the different charts—both Standard and Custom—that are available to you.
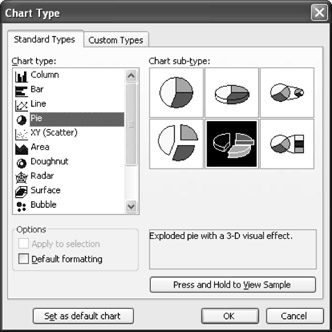
Figure 14-3: The Chart Type dialog box includes more than 30 different chart types you can use to illustrate your data.
| Tip | |
Selecting a Standard Chart Type
The Standard Types tab in the Chart Type dialog box is the first to appear. The type of chart selected in the Chart Type list (and in the Chart Sub-Type section) depends on the type of chart selected in your document.
To choose another chart type, simply scroll through the Chart Type list, and then select the one you want. The examples in the Chart Sub-Type section change to reflect your new choice. Select the sub-type you want by clicking it as well. When you click OK, you are returned to Graph and your chart is updated to show the new chart type.
| Tip | Test your choice If you're not sure how your choice will look and want to test it before you make the change, select the type and the sub-type, and then click Press And Hold To View Sample in the Standard Types tab in the Chart Type dialog box. Graph gives you a preview of your chart, redrawn in the format of the new type. If you like what you see, click OK, and the chart is replaced in your document. |
Choosing a Custom Chart Type
If you don't see what you want in the Standard Types tab in the Chart Type dialog box, you can try the Custom Types tab, shown in Figure 14-4. Click that tab and scroll through the Chart Type list box. You'll see many different styles of all kinds and colors. When you find the one you want, select it, and then click OK. You are returned to your document and the chart change is made.
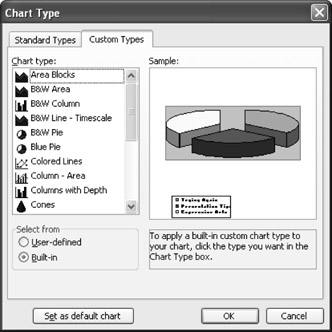
Figure 14-4: The Chart Type Custom Types tab gives you additional choices for more specialized graphs.
| Tip | Notice that if you select a chart you created before you click Chart Type, Graph will display your chart in the preview window so that you can see how it will look when you change it to a different type. |
Setting a New Default Chart Type
If you really like the chart type you've selected, you can make it the default chart that Graph automatically uses whenever you create a new chart. Double-click the chart in your document, and then choose Chart, Chart Type. Click Set As Default Chart to store this chart type as the type Graph uses when you create a new chart.
Creating Your Own Chart Types
If you just can't find the exact chart you want, or if your data needs are specialized for a particular document type, you can create a custom chart type to handle your unique situation. Like creating a style, creating a custom chart style is based on an existing style. You can tailor the existing style by changing colors, bar type, three-dimensional (3-D) or two-dimensional (2-D) effects, background, titles and labels, and more.
To create your own custom chart type, follow these steps:
-
Place the insertion point where you want to create the chart.
-
Choose Insert, Picture, Chart. The default chart and datasheet appear.
-
Change the data as needed and close the datasheet, and then select other chart options such as chart type, color, and style in the way you want them to appear.
-
Click Chart, Chart Type.
-
In the Chart Type dialog box, click the Custom Types tab.
-
In the Select From section, click the User-Defined option. The Custom Types tab changes to show the Default chart type. An Add button appears so that you can add the new chart type to the Chart Type list.
-
Click Add. The Add Custom Chart Type dialog box appears, as shown in Figure 14-5.
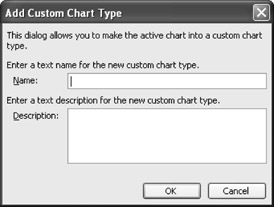
Figure 14-5: When you create a custom chart type, you name the type and add a description in the Add Custom Chart Type dialog box. -
In the Name box, type a name for the chart type.
-
If you want to add a description of the chart or the way it is to be used, click in the Description box, and then type the explanation of the chart type.
-
Click OK to add the custom chart type, and then click OK in the Chart Type dialog box to finish creating the custom chart type.
Tip Use your own chart types When you want to use one of your own custom-designed chart types in a document, choose Insert, Picture, Chart, click the Custom Types tab in the Chart Type dialog box, and then click the User-Defined option. Select the chart you want to use from the Chart Types list, and then click OK. Graph inserts the custom chart in your document.
|
| < Day Day Up > |
|
EAN: 2147483647
Pages: 373