ESTABLISHING BREAKPOINTS
Visual C++ 2005 Express gives you access to several tools that help in tracking down and dealing with errors. These tools can help you monitor your program code as it executes, examine the value of variables and properties, and track the execution path to determine what code is being called and from where.
Throughout this book, you have executed all Visual C++ applications by pressing the F5 key within the Visual C++ IDE. You have been creating what are known as debug versions of your applications. Debug versions contain information within them that enables Visual C++ to help you track down errors.
If your application has debug information embedded within it, you can use breakpoints to cause your application to stop on certain lines of code. This allows you to pause execution, explore your program's internals, and even resume execution after making changes. Such functionality can serve as a highly effective aid in tracking down and locating statements that might be incorrectly setting variable and property values. In Visual C++, this process is known as breaking into a program or debugging with breakpoints.
Setting Up Breakpoints
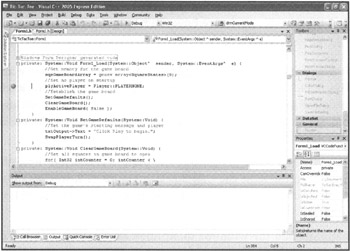
To set up a breakpoint within your application, click on the left margin of the Code Editor on the line where you want to place the breakpoint. After the breakpoint has been set, a circular marker is displayed in the margin, and the line of code where the breakpoint is set is highlighted, as demonstrated in Figure 11.6.

Figure 11.6: Using a breakpoint to pause an application's execution.
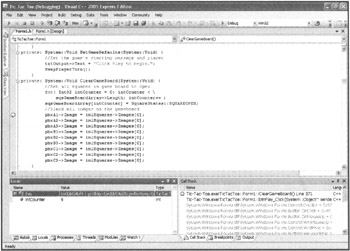
Breakpoints are often useful if you place them at or above locations within your program where you suspect a problem might be occurring. You can set as many breakpoints as you want. When you press F5 to run your application and a breakpoint is reached, program execution pauses, and the circular marker for the current breakpoint changes to display an arrow, as demonstrated in Figure 11.7.

Figure 11.7: The Visual C++ IDE changes the highlight of the currently active breakpoint.
| Trick | After you have resolved any errors that you might have and no longer need breakpoints, you can remove them by clicking on the circular markers located in the left margin. |
Breaking into your program can reveal information about how variable and properties have been set. As Figure 11.7 illustrates, the Locals window and the Call Stack window are opened. The Locals window displays information about variables that reside within the current function or method, including their current value and type. You can change the value assigned to a variable displayed in the Locals window by clicking its value.
You can also use the Call Stack to examine the path of execution through your program so far. For example, if you look at the Call Stack in Figure 11.7, you see ClearGameBoard at the top of the list, with btnPlay_Click just below it. If you click btnPlay_Click, Visual C++ takes you to the point where it called ClearGameBoard.
By using breakpoints and the windows mentioned earlier, you can track down many errors by locating where and when a value, property, or variable was incorrectly modified.
Stepping through Code Execution
Another important debugging technique is the ability to step through your program line by line while it is executing. This allows you to watch your program make changes in real-time. It also can help you identify a section of code that might be causing errors. You can set a breakpoint, allow the program to execute up to that point, and then step through and execute each subsequent statement one line at a time. When you do so, you can track the flow of logic, pausing at any point along the way to examine a value, related variables, or property.
Visual C++ gives you three different ways to step through your program statements:
-
Step Into. Executes the Breakpoint statement and pauses before the execution of statements that follow
-
Step Over. Executes entire functions, pausing before the execution of the next function
-
Step Out. Used inside a function to return to the calling function where program flow is then paused
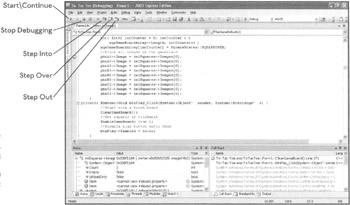
You can selectively choose which of these step options you want to use at any moment by clicking on their icons, which are located in the Visual C++ standard toolbar, as shown in Figure 11.8.

Figure 11.8: Using the Debug icons on the standard toolbar to step through program statements.
EAN: N/A
Pages: 131