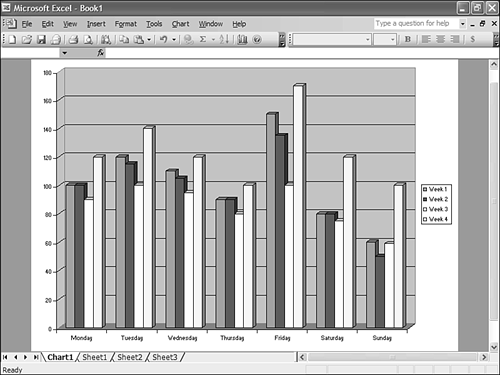
| Numbers are fine, but sometimes the story behind the numbers can be better told through a picture. The way you take a picture of numbers is with a chart, such as the one shown in Figure 14.6. Figure 14.6. Some numbers are better represented via a chart. 
You create a chart based on numbers you've previously entered into your Excel spreadsheet, like this: Select the range of cells you want to include in your chart. (If the range has a header row or column, include that row or column when selecting the cells.)
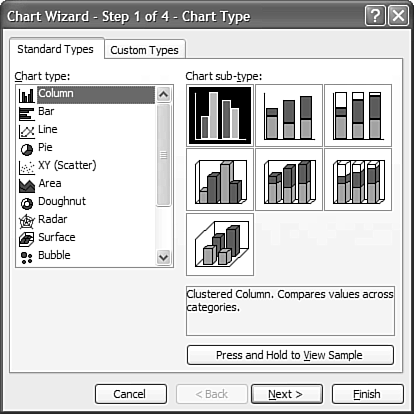
Click the Chart Wizard button to display Step 1 of the Chart Wizard, shown in Figure 14.7.
Figure 14.7. Create one of a dozen types of charts to visually represent your data. 
Select the Standard Types tab, select a chart type and sub-type, then click Next. (Alternately, select the Custom Types tab to design your own chart type from scratch.)
tip  | To see how your numbers will appear in a selected chart type, click the Press and Hold to View Sample button. |
When Step 2 of the Chart Wizard appears, verify the data range selected, then click Next.
When Step 3 of the Chart Wizard appears, select each tab in turn to select various formatting options. You can add titles, gridlines, legends, labels, and so forth to your chart. Click Next when you're ready to proceed.
When Step 4 of the Chart Wizard appears, select whether you want to create a new sheet within your worksheet for your chart, or whether you want to place the chart on the existing spreadsheet page.
Click Finish to create the chart.
The Absolute Minimum Here are the key points to remember from this chapter: Popular spreadsheet programs include Microsoft Excel, Lotus 1-2-3, Corel's Quattro Pro, and the Works Spreadsheet included in Microsoft Works and Works Suite. A spreadsheet is composed of rows and columns; the intersection of a specific row and column is called a cell. Each cell can contain text, numbers, or formulas. You start an Excel formula with an = sign, and follow it up with specific numbers (or cell locations) and operators such as +, -, *, and /. To graphically display your spreadsheet data, select the appropriate cells and then click the Chart Wizard button.
|
|

