Anatomy of a Monitor
A monitor, which belongs to a data group at some level, is made up of the following elements:
- A data collector
- Zero or more thresholds
- Zero or more action associations
Let's examine data groups before covering the elements that make up a monitor.
Data Groups
A data group's primary purpose is to let you organize data collectors into a structure by using the data group as a container. A second but equally important function of a data group is that it enables you to treat more than one collector as a single entity.
A data group reflects the worst state of any of its children; therefore, an action can be associated with the data group rather than the data collectors it contains. The purpose is to trigger one event when one of a number of things goes wrong, and then trigger a second event when all the collectors return to the OK state.
For example, assume that we have a data group containing three data collectors. When the first data collector, which could be any one of the three, exceeds its threshold, the data group is flagged as unhealthy and the action associated with the data group is triggered. In cases where more than one data collector exceeds its threshold, all the data collectors have to return to a healthy state before the data group itself is flagged as healthy.
The Online/Offline Monitors data group, presented in "Online/Offline Monitors" later in this chapter, illustrates how an action, or in this case, actions, can be associated with a data group.
Data Collectors
Data collectors provide the fundamental mechanism for collecting data that can be used by a monitor. Every collector is configurable through a datacollectorname Properties dialog box (Figure 9.7), which you can use either to configure a new collector or to modify an existing collector.
The Memory Properties dialog box presents five tabs that are used to provide configuration information for a data collector. The General, Actions, Schedule, and Message tabs are common to all the collectors, whereas the information required for the Details tab varies according to the type of data collector that you're configuring.
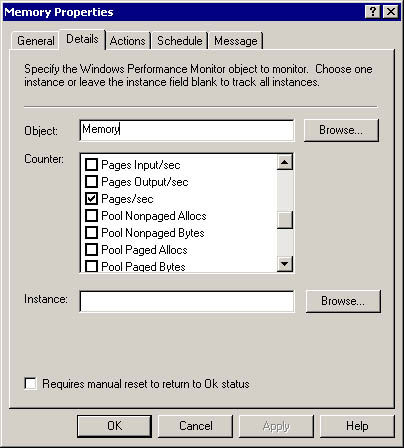
Figure 9.7 Memory Properties dialog box
General Tab
The General tab is used to provide the collector name, which is the collector type by default, and has a Comments box that can be used to provide descriptive information about the collector.
NOTE
If it isn't provided, the collector's name will default to the data collector's query, which reflects what the data collector is collecting.
Details Tab
As indicated earlier, the Details tab for the various collectors varies according to the type of collector that you're modifying or creating. Table 9.1 summarizes the different types of collectors and the configuration information that's available—and in some cases mandatory—for each collector.
Actions Tab
The Actions tab is used to identify the action to take, the condition that will trigger the action, and to enable a reminder message. The following default actions (for more details, see "Thresholds and Actions" later in this chapter) are available:
- Bring Server Online
- Email Administrator
- Log to offline.log
- Log to websitefailures.log
- Take Server Offline
The three execution conditions that are available for an action are Ok, Warning, and Critical. Critical is the default condition when a threshold is reached. The reminder option can be configured for n seconds, minutes, or hours. The action that you identify is fired when a data group or data collector changes state. In addition to these default actions, you can also create custom actions. For more information, see "Modifying and Creating Actions" later in this chapter.
Schedule Tab
The Schedule tab is used to establish the collection days and collection times for the data collector, which by default is 7-day/24-hour. In addition, you can establish the collection interval as well as the total samples that should be used for threshold measurement here. The available settings are:
- Collection days—Every day of the week is marked by default.
- Collection times—All day is set by default, and you specify periods during the day by using Only from: hh:mm to hh:mm or by exclusion using All day except: hh:mm to hh:mm.
- Collection interval—Collect every n period, where period is expressed in seconds, minutes, or hours. The minimum, except for event queries, is 10 seconds. This can impact system performance if a query is expensive to make and is made too frequently. Also, requests can get backlogged if the time to retrieve the query is less than the query interval, which is to say, the next query is getting made before the previous query is finished.
- Total samples for average calculation—Select an integer value.
Message Tab
Two messages are available. The first is triggered when the collector's status changes to Critical or Warning and takes the following syntax, which does a string substitution for the values enclosed in percent (%) symbols and imbeds the collector name, state, error code, and error description in a text message:
%EmbeddedCollectedInstance.Name% service is
%EmbeddedCollectedInstance.State%: %State% condition. (WMI Status: %
CollectionErrorCode% %CollectionErrorDescription%)
NOTE
The properties contained in the insertion strings (%%) are filled out when the message is sent. This enables you to include additional tracking information, such as the server name, date and time, or any data that was retrieved by the monitor.
The second message is displayed when the collector's status is healthy and takes the following form:
%Name% is Ok.
These are default messages, and you can create any message that you want to have displayed or sent in these areas.
Types of Data Collectors
You have nine different types of data collectors at your disposal for creating custom data collectors. Table 9.1 provides information about each of these collectors, including their configuration options on the Details tab. The Performance, Service, Process, Windows Event Log, and COM+ application monitors all use WMI, and like the WMI Instance, WMI Event Query, and WMI Data Query, are limited in scope to the local server. The Ping, TCP/IP, and HTTP monitors extend monitoring capability to the network.
Table 9.1 Data Collector Types and Configuration Options
| Data collector | Details tab configuration options | Default configuration |
|---|---|---|
| Performance Monitor | Identify the object, select the counter to use, and if applicable, identify the instance | |
| Service Monitor | Identify the service. | Properties: Display Name, Started, State, and Status |
| Process Monitor | Identify the process. | Properties: Status |
| Windows Event Log Monitor | Identify the event type from: Information, Success audit, Warning, Failure audit, and Error. | Event type: Warning, Failure audit, and Error |
| Choose one of three log file options: Application, Security, and System. Identify the Source, and if necessary the Category, Event ID, and User. | Log file: Application | |
| COM+ Application | Identify the application name. | Properties: Aborted Transactions Per Second, Admin Shutdowns, Application Name Committed Transactions Per Second, Failure Shutdowns, Handle Count, Object Activations Per Second, Object Creations Per Second, Object Pool, Thread Count Timeouts, Timeout Shutdowns, Total Aborted Transactions, Total Committed Transactions, Total Shutdowns, Virtual Size, Working Set Size |
| HTTP Monitor | Identify the URL, and specify its timeout period. | Timeout: 30 seconds |
| If necessary, provide the following logon information: authentication (None, Clear Text, Windows Default, NTLM, Digest, Kerberos), User name, and Password. If a proxy server is involved, provide its address and port number; and if necessary, the credentials to use with it. | Authentication: None | |
| TCP/IP Monitor | Identify the system, the system's port number, and the timeout, in milliseconds. | Timeout: 10000 |
| Ping (ICMP) Monitor | Identify the system and timeout, in milliseconds. | Timeout: 1000 |
| WMI Instance | Identify the namespace, and select a class and instance. | Namespace: root\CIMV2 |
| WMI Event Query | Identify the namespace and class. Specify the type of WQL event query (Intrinsic or Extrinsic), and provide the query. | Namespace: root\CIMV2 WQL event query: Extrinsic |
| WMI Data Query | Identify the namespace and class, and provide the query. | Namespace: root\CIMV2 |
NOTE
A data collector functions as both a consumer and as a provider. As a consumer, it gathers data from events or properties and tests values against its threshold. The data collector becomes a provider when a threshold is crossed and it changes state. The data collector fires a status change notification that an action—a WMI consumer—is listening for.
Let's examine one of the default data collectors to see how it's configured. We'll use Synchronization Session Failure and review its configuration for each tab of its properties dialog box.
Synchronization Session Failure Properties Dialog Box Configuration
- General tab
- Name: Synchronization Session Failure
- Details tab
Namespace: root\MicrosoftApplicationCenter
Class: MicrosoftAC_Replication_Session_General_Event
Properties:EventId
ReplicationJobID
StatusMessage
WQL event query:Type=Extrinsic
"SELECT * FROM MicrosoftAC_Replication_Session_General_Event
WHERE EventId=5037 OR EventID=5038"Requires manual reset to return to Ok status: cleared
Status reset
You can use either an automatic or manual reset to return a data collector to Ok status.Automatic reset
By default, a data collector will reset its state to Ok when the values it collects return below the specified thresholds. For example, if an HTTP monitor data collector gets an "access denied" error while attempting to access a Web page, the state of the data collector will change to Critical. However, if the next attempt to access the Web page is successful, the collector's state returns to Ok. In most cases, this is the desired behavior because it ensures that the Health Monitor snap-in displays the most current information about the status of monitored applications and components.
Manual reset
In some cases an automatic reset is not desired. You may want to manually verify the condition of a component before declaring it fixed, or have a threshold determine that its status should reset to Ok. If you've enabled manual reset on a data collector, the collector remains in a Warning or Critical state until you do a manual reset.
A manual reset might be required in monitoring environments where it isn't possible to verify a successful operation automatically. Although most Health Monitor data collectors poll at regular intervals to detect fixed problems, there are a few collectors that are event-based (such as Windows Event Log Monitor and WMI Event Query). Therefore, when Health Monitor receives an event indicating failure, there is no way for Health Monitor to recheck the status to determine when the failure condition has changed.
- Actions tab
Actions: Email Administrator
Execution condition: Critical
Reminder: Null
- Schedule tab
Collection days: Every day of week
Collection times: All day
Collection interval: 1 second
Total samples for average calculation: 6
- Message tab
When status changes to Critical or Warning: %Name%: %State% condition.
WMI Status: %CollectionErrorCode%
%CollectionErrorDescription%When status is Ok: %Name% is Ok.
Synchronization Session Failure Thresholds
Two thresholds are set for the Replication Session Failure collector:
- The WMI status check (Error Code (from WMI) !=0), which is common to all the default collectors, watches for WMI errors—the assumption is that a WMI failure should be flagged as a critical condition.
- A check is made to see if events 5037 (replication job succeeded), 5038 (replication job failed-source only), or 5043 (replication session commit-target only) were fired. If EventID is 5038, the collector's status is set to Critical and the send e-mail to the administrator action is triggered. The next time the data collector makes its query and receives event 5037 or 5043, the collector's status returns to Ok.
Thresholds and Actions
Application Center automates several aspects of cluster administration by using thresholds and actions. A threshold changes the state of a data collector or data group. The purpose of a threshold is to evaluate the data or properties returned by the collector. Subsequent actions are triggered by this change in state. An e-mail notification is an example of one of these actions.
A threshold is a monitoring rule that is applied to the property, or value of a data collector. When the threshold satisfies the rule, an action, such as sending an e-mail notification, is initiated. As you will see in Table 9.2, several kinds of actions can be associated with a threshold.
Table 9.2 Application Center Actions
| Action | Description |
|---|---|
| Notification | An e-mail message is sent to the administrator or another designated recipient. This e-mail is sent automatically when the threshold is exceeded and can include information about the event, such as event severity and the time at which the event occurred. |
| Restarting the server1 | The affected member, or even the cluster, is restarted if this is the designated action. |
| Running a batch or executable file1 | A batch (*.bat) file or any executable(*.exe) file that is compatible with Windows 2000 is run automatically. |
| Generating a Windows 2000 event | You can configure Health Monitor to generate a Windows 2000 event, which will be recorded in the Windows 2000 Event Log. Using WMI, this event is also available to other applications and services. |
| Writing text to a log | The occurrence and related information is recorded in a log file. This log can be in any supported log file format. |
| Running a script1 | Scripts written in Microsoft Visual Basic Scripting Edition (VBScript) or Microsoft JScript development software can be run automatically in response to an exceeded threshold. |
1. These actions could have security implications, so they should be accessible to administrators only.
To learn how you can customize the default actions that Application Center provides, or create new actions to automate your monitoring, see "Modifying and Creating Actions" later in this chapter.
EAN: N/A
Pages: 183