9.4 Troubleshooting
|
| < Day Day Up > |
|
9.4 Troubleshooting
The first step of problem determination is to know what information is available to you. Whenever DB2 UDB performs an operation, there is a return code associated with that operation. The return code is displayed to the user in the form of an informational or error message. These messages are logged into diagnostic files depending on the diagnostic level set in the DB2 Manager Configuration. In this section, we discuss the DB2 diagnostic logs, error message interpretation, tips that may help with problem determination, troubleshooting, as well as the resolutions to some specific problems.
The following actions should be taken when experiencing a DB2 related problem:
-
Check related messages
-
Explain error codes
-
Check documentation
-
Search through available Internet resources
-
Review APARs for current FixPak level
-
Use available tools to narrow the problem
-
Ask IBM for support
9.4.1 Interpreting DB2 informational messages
Start your investigation from the return code. DB2 UDB provides a return code for every operation performed in the form of CCCnnnnnS. The prefix CCC identifies the DB2 UDB component that is returning the message; the nnnnn is a four or five digit number which is also referred to as SQLCODE; and the S is a severity indicator. For example, SQL0289N the SQL component identifier, represents a message from the Database Manager, the SQLCODE is 0289, which is an error message.
Here is the complete list for DB2 UDB error messages to prefix your reference:
-
SQL Database Manager messages
-
DB2 Command Line Processor messages
-
ASN Replication messages
-
CLI Call Level Interface messages
-
SQJ Embedded SQLJ in Java messages
-
SPM Synch Point Manager messages
-
DBI Installation or configuration messages
-
DBA Control Center and Database Administration Utility messages
-
CCA Client Configuration Assistant messages
-
DWC Data Warehouse Center messages
-
FLG Information Catalog Manager messages
-
SAT Satellite messages
The three severity indicators are:
-
W: Indicates warning or informational messages
-
N: Indicates error messages
-
C: Indicates critical system errors
DB2 UDB also provides detailed information for each message. The full error message describes the nature of the problem in detail and potential user responses. To display the DB2 UDB return code full message, you can use the DB2 command db2 ? error-code. In AIX or Linux, since ? (question mark) is a special character, you need to separate the DB2 command and the error code with a double quote ("). See Example 9-8.
Example 9-8: Explaining error codes
db2 "? sql0289" SQL0289N Unable to allocate new pages in table space "<tablespace-name>". Explanation: One of the following conditions is true: 1. One of the containers assigned to this SMS table space has reached the maximum file size. This is the likely cause of the error. 2. All the containers assigned to this DMS table space are full. This is the likely cause of the error. [...]
You can find full information about the DB2 message format, and a listing of all the messages in DB2 UDB Messages Reference, Volumes 1 and 2.
9.4.2 DB2 diagnostic logs
DB2 UDB logs every return code in diagnostic logs based on the diagnostic level set in the database manager configuration. When investigating DB2 problems, the essential information can be found in diagnostic log files generated by DB2. These logs are:
-
db2diag.log
-
Notify files
-
Trap files
-
Dump files
-
Messages files
db2diag.log
The db2diag.log is the most often used file for DB2 problem investigation. You can find this file in the DB2 UDB diagnostic directory, defined by the DIAGPATH variable in the Database Manager Configuration. If the DIAGPATH parameter is not set, by default the directory is located at:
UNIX:
$HOME/sqllib/db2dump
where $HOME is the DB2 instance owner's home directory.
Windows:
<INSTALL PATH>\<DB2INSTANCE>
where <INSTALL PATH> is the directory where DB2 is installed, and <DB2INSTANCE> is the name of DB2 instance.
The database manager configuration parameter DIAGLEVEL controls how much information is logged to the db2diag.log.Valid values can range from 0 to 4:
-
0 - No diagnostic data captured
-
1 - Severe errors only
-
2 - All errors
-
3 - All errors and warnings (default)
-
4 - All errors, warnings and informational messages
Most of the time, the default value is sufficient for problem determination. In some cases, especially on development or test systems you can set the parameter to 4, and collect all informational messages. However, be aware that depending on the activity, this may cause performance issues due to the large amount of data recorded into the file. Setting DIAGLEVEL to 4 may also make the file very large and harder to read.
The information in the db2diag.log includes:
-
A diagnostic message (beginning with DIA) explaining the reason for the error.
-
Application identifiers, which allow matching up error entries with corresponding application or db2 server processes
-
Any available supporting data, such as SQLCA data structures, and pointers to the location of any extra dump or trap files.
-
Administrative events, i.e. backup/restore start and finish
Example 9-9 contains extract of db2diag.log taken at DIAGLEVEL 3.
Listing 9-9: Example of db2diag.log file
[1] 2003-07-29-02.26.33.004000 [2] Instance:DB2INST1 [3] Node:000 [4] PID:1012(db2syscs.exe) [5] TID:1996 [6] Appid:*LOCAL.DB2.00E049090924 [7] data management [8] sqldEscalateLocks [9] Probe:3 [10] Database:DB2_EMP2 [11] ADM5502W The escalation of "1251" locks on table "DB2INST1 .TABLE01" to lock intent "X" was successful.
Explanation of db2diag.log entries are included below. The number in parenthesis corresponds to the following numbers:
| [1] | The date and timestamp of the entry made into the log. |
| [2] | The name of the instance. In this example DB2INST1. |
| [3] | The node or partition number. This number is always 0 in a single partition configuration |
| [4] | The process ID of the application or agent |
| [5] | The thread ID of the application or agent. This is only used on the Windows platform. |
| [6] | The application ID. This corresponds to the LIST APPLICATIONS command output. Each application has a unique application ID. |
| [7] | Component name |
| [8] | The name of the function in the component that is reporting an error or information. |
| [9] | The probe point in the function. This corresponds to a location in the source code of the function that has returned an error or information. |
| [10] | Name of the accessed database that generated the message. |
| [11] | Diagnostic information. In this example this is a administration warning, telling about lock escalation (1251 row locks where successfully replaced by one table lock) on table DB2INST1.TABLE01. |
Notify files
DB2 UDB also provides diagnosis information at the point failure to the administration notification log. On UNIX platforms, the administration notification log is a text file called <instance>.nfy, where <instance> is the name of the instance. On Windows, all administration notification messages are written to the Event Log.
The DBM configuration parameter NOTIFYLEVEL specifies the level of information to be recorded:
-
0 - No administration notification messages captured (not recommended)
-
1 - Fatal or unrecoverable errors
-
2 - Immediate action required
-
3 - Important information, no immediate action required (default)
-
4 - Informational messages
Not only can DB2 UDB write to the notify logs, but also the Health Monitor, the Capture and Apply programs, and user applications using the db2AdminMsgWrite API.
Trap files
Whenever a DB2 UDB process receives a signal or exception (raised by the operating system as a result of a system event) that is recognized by the DB2 signal handler, a trap file is generated in the DB2 diagnostic directory. The files are created using the following naming convention:
UNIX:
-
tpppppp.nnn
-
pppppp: the process ID (PID)
-
nnn: the node where the trap occurred
-
Example: t123456.000
-
Windows:
-
DBpppttt.TRP
-
ppp : the process ID (PID)
-
ttt : the thread ID (TID)
-
Example: DB123654.TRP
-
Depending on the signal received or the exception raised, the existence of these files can indicate different extremes of consequences. These consequences can range from the generation of a simple stack trace back for additional diagnostics, to a complete DB2 instance shutdown due to a serious internal or external problem. A list of all available signals for selected operating systems can be obtained from the following files:
-
UNIX: /usr/include/sys/signal.h
-
Windows (requires the software development kit): Winnt.h
Dump files
When DB2 determines that internal information needs to be collected, it will often create binary dump files in the diagnostic path. These files are generated with the following format:
UNIX:
-
pppppp.nnn or lpppppp.nnn (for lock list dump)
-
pppppp: the process ID (PID)
-
nnn: the node where the problem occurred
-
Example: 123456.000
-
Windows:
-
pppttt.nnn or lpppttt.nnn (for lock list dump)
-
ppp: the process ID (PID)
-
ttt: the thread ID (TID)
-
nnn: the node where the problem occurred
-
Example: 123654.000
-
Messages files
Some DB2 UDB utilities like BIND, LOAD, EXPORT, and IMPORT provide an option to dump out a messages file to a user-defined location. These files contain useful information to report the progress, success, or failure of the utility that was run.
9.4.3 DB2 support information
Identifying what information is typically required to resolve problems is a very important step. All the conditions that define the problem are essential when reviewing documentation, searching through available Internet resources, or contacting DB2 support.
Maintenance version
The Db2level utility can be used to check current versions of DB2 UDB. As presented in Figure 9-5, the utility returns information about the installed maintenance updates (FixPaks); length of word used by instance (32 bit or 64 bit); build date; and other code identifiers. It is a good habit to check periodically if here are the newest available FixPaks. DB2 maintenance updates are freely available at:
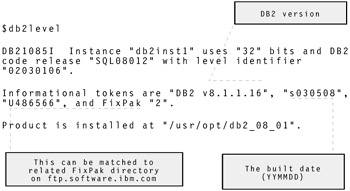
Figure 9-5: Sample db2level output
ftp://ftp.software.ibm.com/ps/products/db2/fixes
db2support utility
The db2support utility is designed to automatically collect all DB2 and system diagnostic data. This program generates information about a DB2 server, including information about its configuration and system environment. The output of this program is stored in one compressed file named db2support.zip, located in the directory specified as part of the command invoked under command line. In one simple step, the tool can gather database manager snapshots, configuration files, and operating system parameters, which should make the problem determination quicker. Below there is a sample call of the utility:
db2support . -d db2_emp -c
The dot represents the current directory where the output file is stored. The rest of the command is optional. -d and -c instructs the utility to connect to the db2_emp database, and also gather information about database objects such as table spaces, tables, or packages.
DB2 Technical Support site
An invaluable place to look if experiencing a problem is the DB2 Technical Support site for Linux, OS/2®, Windows, and UNIX located on the Web at:
http://www.ibm.com/software/data/db2/udb/winos2unix/support
The site has the most recent copies of the documentation, the knowledge base to search for technical recommendations or DB2 UDB defects, links for product updates, the latest support news, and many useful DB2 UDB related links.
To find related problems, prepare words that describe the issue like the commands that were run, the symptoms, and tokens from the diagnostics messages, and use them as a search terms in DB2 Knowledge Base. The Knowledge Base offers an option to search through DB2 UDB documentation, TechNotes, and DB2 UDB defects (APARs).
TechNotes is a set of recommendations and solutions for specific problems. For example, to check which operating system patches are needed for DB2 UDB installation on the Solaris operating system, click the Advanced Search selection on navigation menu, and type the solaris patch keywords as presented in Figure 9-6, and click Search DB2 V8 Information Center at the bottom of the screen.
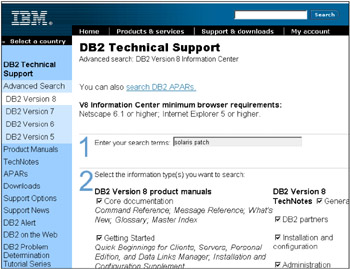
Figure 9-6: Searching for problem resolutions using TechNotes
The search returned one document in the Installation and Configuration category for TechNotes as presented in Figure 9-7.
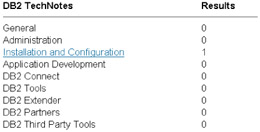
Figure 9-7: Sample TechNotes search results
The following the link leads to the desired document describing Sun Solaris versions supported by DB2 UDB (Figure 9-8).
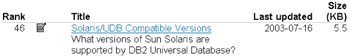
Figure 9-8: Sample TechNotes document link
Authorized Program Analysis Reports (APARs) are defects in DB2's code discovered by customers that require a fix. APARs have unique identifiers and are always specific to a particular version, but may affect multiple products in the DB2 family running on multiple platforms. Fixes for APARs are provided through DB2 UDB FixPaks.
On the DB2 support site there is a possibility to search for closed, open, and HIPER APARs. A status of closed APAR indicates the resolution for the problem has been verified and included in the FixPaks. Open APARs represent DB2 UDB defects that are currently being worked upon or waiting to be included in the next available FixPak. HIPER APARs (High-Impact or PERvasive) are critical problems that should be reviewed to assess the potential impact of staying at a particular FixPak level.
DB2 Technical Support site offers e-mail notification of critical or pervasive DB2 UDB customer support issues, including HIPER APARs and FixPak alerts. To subscribe it, follow the DB2 Alert link on the Technical Support main page, and provide your e-mail as shown on Figure 9-9.
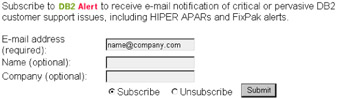
Figure 9-9: Subscribing DB2 alert
Calling IBM support
If the problem seems to be too complex to solve on your own, you can contact the IBM Software Support Center. In order to understand and resolve your support service request in the most expedient way possible, it is important that you gather information about the problem and have it on hand when talking to the software specialist.
The guidelines and reference materials (which you may need when require IBM support) as well the telephone numbers are available on IBM Software Support Guide:
http://techsupport.services.ibm.com/guides/handbook.html
9.4.4 Problem determination tools
Tuning and troubleshooting a database can be a complex process. DB2 UDB comes with a great number of tools, functions, and applications that make this task much simpler.
Monitoring tools
DB2 UDB monitoring utilities can collect information on many different system activities, like usage of buffer pools, locks held by applications, sorts preformed by system, activities on tables, connections, transactions statistics, or statements run on the system. There are two main methods of monitoring:
-
Snapshot monitoring
-
Event monitoring
Snapshot monitoring
Snapshot monitoring describes the state of database activity at the particular point in time the snapshot is taken. Snapshot monitoring is useful in determining the current state of the database and its applications. Because snapshots provide the point in time data, usually they are executed in scripts on regular intervals.
Snapshots can be taken from the command line, using custom API program or through SQL using table functions. Example 9-10 shows extract from sample snapshot invoked form the command line.
Example 9-10: Example snapshot
db2 get snapshot for database on db2_emp Database Snapshot Database name = DB2_EMP Database path = /db2/home/db2inst1/db2inst1/NODE0000/SQL00001/ Input database alias = DB2_EMP Database status = Active [...] High water mark for connections = 3 Application connects = 7 Secondary connects total = 0 Applications connected currently = 1 Appls. executing in db manager currently = 0 Agents associated with applications = 1 Maximum agents associated with applications= 1 Maximum coordinating agents = 1 [...] Buffer pool data logical reads = Not Collected Buffer pool data physical reads = Not Collected Asynchronous pool data page reads = Not Collected [...]
The snapshot collects database level information for database DB2_EMP. Some of the returned parameters display point in time values such as the number of currently connected applications:
Applications connected currently = 1
Some parameters represent cumulative values like the number of connect statements issued against the database:
Application connects = 7
Some parameters can contain historical values like the maximum number of concurrent connections that have been observed on the database:
High water mark for connections = 3
The cumulative or historical values relate to the point in time, since the last counter's initialization. The counters can be reset to zero by the RESET MONITOR command, or by the appropriate DB2 event. With the mentioned Example 9-10 database deactivation and activation will reset all the database level counters. Example 9-11 shows how to reset monitors for entire instance and for the specific database.
Example 9-11: Resetting snapshot monitor counters
db2 reset monitor all db2 reset monitor for database db2_emp
To optimize database performance in a default DB2 configuration, most of the snapshot monitor elements are not collected. Because of that reason, in Example 9-10 the value Not Collected was displayed for the buffer pool statistics. DB2 UDB contains monitor switches to provide database administrators with the option of constraining the collection of monitor elements. Current monitor switches set for the session can be displayed from the command line by GET MONITOR SWITCHES, as shown in Example 9-12.
Example 9-12: Displaying monitor switches
db2 get monitor switches Monitor Recording Switches Switch list for db partition number 0 Buffer Pool Activity Information (BUFFERPOOL) = OFF Lock Information (LOCK) = OFF Sorting Information (SORT) = OFF SQL Statement Information (STATEMENT) = OFF Table Activity Information (TABLE) = OFF Take Timestamp Information (TIMESTAMP) = ON 08-01-2003 23:01:51.019864 Unit of Work Information (UOW) = OFF
The monitor switches can be turned on at the instance level or at an application level. To switch the monitors at the instance level, modify the appropriate database manager parameter. After modifying the DFT_MON_BUFPOOL parameter, as shown in Example 9-13, all users with administration authorities will be able to collect buffer pool statistics on any database in the instance.
Example 9-13: Updating monitor switches at instance level
db2 update dbm cfg using DFT_MON_BUFPOOL ON
To switch the monitors at the application level, issue UPDATE MONITOR SWITCHES from the command line. The changes will only be applicable to that particular prompt window. Example 9-14 shows how to update the suitable monitor switch for collecting buffer pool information.
Example 9-14: Updating monitor switches at application level.
db2 update monitor switches using BUFFERPOOL ON
The complete list of monitor switches and related database manager parameters is presented on Table 9-2.
| Database manager parameter | Monitor switch | Information provided |
|---|---|---|
| DFT_MON_BUFFERPOOL | BUFFERPOOL | Number of reads and writes, time taken |
| DFT_MON_LOCK | LOCK | Lock wait times, deadlocks |
| DFT_MON_SORT | SORT | Number of heaps used, sort performance |
| DFT_MON_STMT | STATEMENT | Start/stop time, SQL statement identification |
| DFT_MON_TABLE | TABLE | Measure of activity (rows read/written) |
| DFT_MON_UOW | UOW | Start/end times, completion status |
| DFT_MON_TIMESTAMP | TIMESTAMP | Timestamps |
Sample snapshots
The database manager snapshot (Example 9-15) captures information specific to the instance level. The information centers on the total amount of memory allocated to the instance and the number of agents that are currently active on the system.
Example 9-15: Database manager snapshot
db2 get snapshot for database manager
The lock snapshot (Example 9-16) is very useful in determining what locks an application currently is holding, or what locks another application is waiting on. The snapshot lists all applications on the system and the locks that each is holding. Each lock, and each application, is given a unique identifier number.
Example 9-16: Lock snapshot.
db2 get snapshot for locks on db2_emp
The table snapshot (Example 9-17) contains information on the usage and creation of all tables. This information is quite useful in determining how much work is being run against a table and how much the table data changes. This information can then be used to decide how your data should be laid out physically.
Example 9-17: Table snapshot
db2 get snapshot for tables on db2_emp
The table space and buffer pool snapshots (Example 9-18) contain similar information. The table space snapshot returns information on the layout of the table space and how much space is being used. The buffer pool snapshot contains information on how much space is currently allocated for the buffer pool and how much space will be allocated when the database is next reset. Both snapshots contain a summary of the way in which data is accessed from the database. This access can be done from a buffer pool, direct from tables on disk, or through a direct read or write for LOBs or LONG objects.
Example 9-18: Table space and buffer pool snapshots
db2 get snapshot for tablespaces on db2_emp db2 get snapshot for bufferpools on db2_emp
The dynamic SQL snapshot is used extensively to determine how well SQL statements are performing. This snapshot summarizes the behavior of the different dynamic SQL statements that are run. The snapshot does not capture static SQL statements, so anything that was pre-bound will not show up in this list. The snapshot is an aggregate of the information concerning the SQL statements. If a SQL statement is executed 102 times, then there will be one entry with the summary of the total behavior of the 102 executions.
Example 9-19: Dynamic SQL snapshot
db2 get snapshot for dynamic sql on db2_emp
Snapshot table functions
As mentioned earlier DB2 UDB features the capability to capture snapshots using SQL table functions. Accessing snapshot information through SQL interface is very continent, because the requested information can be filtered and sorted, thereby presented in more readable format. The snapshot table functions can be also very helpful in analyzing system utilization over a time period.
Most of the snapshot table functions accept two input parameters. The first is a string representing the database name. Entering NULL value for the database name parameter instruct the function to get snapshot information for all databases in the instance. The second parameter represents partition number. To capture a snapshot for the currently connected partition, enter a value of -1 or a NULL.
The query in Example 9-20 uses table function SNAPSHOT_TABLE() to retrieve the five table names, which have the most read and write activity on database DB2_EMP.
Example 9-20: Sample snapshot table function
db2 "select snapshot_timestamp, table_name, rows_written, rows_read, rows_written + rows_read as rows_accessed from table (SNAPSHOT_TABLE('DB2_EMP', -1))as T order by rows_accessed desc fetch first 5 rows only" TABLE_NAME ROWS_WRITTEN ROWS_READ ROWS_ACCESSED ------------- ------------ ---------- -------------- EMPLOYEE 0 256 256 STAFF 35 105 140 SYSTABLES 0 30 30 SYSROUTINES 0 10 10 INTERNAL 0 5 5 Example 9-21 illustrates a usage of the SNAPSHOT_DYN_SQL function, which is very useful for finding the SQL statements that are taking the most time in the database.
Example 9-21: Sample snapshot table function
SELECT stmt_text, total_exec_time, num_executions FROM TABLE( SNAPSHOT_DYN_SQL('DB2_EMP', -1)) as dynSnapTab ORDER BY total_exec_time desc FETCH FIRST 5 ROW ONLY Example 9-22 finds the five SQL statements with the worst average execution time.
Example 9-22: Sample snapshot table function
SELECT CASE WHEN num_executions = 0 THEN 0 ELSE (total_exec_time / num_executions) END avgExecTime, num_executions, stmt_text FROM TABLE(SNAPSHOT_DYN_SQL('DB2_EMP', -1)) as dynSnapTab ORDER BY avgExecTime desc FETCH FIRST 5 ROWS ONLY Like snapshot commands, snapshot table functions access point-in-time data kept by monitors in memory. To keep the history of the snapshots include SNAPSHOT_TIMESTAMP column in the snapshot query. Create a table based on the snapshot query, such as presented in Example 9-23, and periodically stores the results of the query in the table.
Example 9-23: Storing snapshot data in a table
db2 create table table_snap_hist as (select snapshot_timestamp, table_name, rows_written, rows_read, rows_written + rows_read as rows_accessed from table (SNAPSHOT_TABLE('DB2_EMP', -1))as T) definition only db2 "insert into table_snap_hist select snapshot_timestamp, table_name, rows_written, rows_read, rows_written + rows_read as rows_accessed from table (SNAPSHOT_TABLE('DB2_EMP', -1))as T order by rows_accessed desc fetch first 5 rows only" Table 9-3 lists the more commonly used snapshot table functions. A complete list and detailed descriptions of snapshot table functions can be found in DB2 UDB System Monitor Guide and Reference, SC09-4847.
| Snapshot table function | Information returned |
|---|---|
| SNAPSHOT_DBM | Database manager information |
| SNAPSHOT_DATABASE | Database information. Information is returned only if there is at least one application connected to the database. |
| SNAPSHOT_APPL | General application information for each application that is connected to the database on the partition. This includes cumulative counters, status information, and most recent SQL statement executed (if the statement monitor switch is set). |
| SNAPSHOT_APPL_INFO | General application identification information for each application that is connected to the database on the partition. |
| SNAPSHOT_LOCKWAIT | Application information regarding lock waits for the applications connected to the database on the partition. |
| SNAPSHOT_STATEMENT | Application information regarding statements for the applications connected to the database on the partition. This includes the most recent SQL statement executed (if the statement monitor switch is set). |
| SNAPSHOT_TABLE | Table activity information for each table that was accessed by an application connected to the database. Requires the table monitor switch. |
| SNAPSHOT_LOCK | Lock information at the database level, and application level for each application connected to the database. Requires the lock monitor switch. |
| SNAPSHOT_TBS | Information about table space activity at the database level, the application level for each application connected to the database, and the table space level for each table space that has been accessed by an application connected to the database. Requires the buffer pool monitor switch. |
| SNAPSHOT_BP | Buffer pool activity counters for the specified database. Requires the buffer pool monitor switch. |
| SNAPSHOT_DYN_SQL | Point-in-time statement information from the SQL statement cache for the database. |
Similar to snapshot commands, the amount of information returned from table snapshots functions is controlled by the monitor switches. Because snapshots can collect large amounts of diagnostic data, enabling all monitor switches (especially DYNAMIC SQL) can have a very negative impact on database performance.
All the monitoring utilities uses memory heap, controlled by MON_HEAP_SZ database manager parameter. This monitoring heap size should be increased when many applications access snapshot data.
Event monitoring
Event monitors are used to monitor the performance of DB2 over a fixed period of time. The information that can be captured by an event monitor is similar to the snapshots, but event monitors examine transition events in the database, and consider each event as an object. Event monitors can capture information about DB2 events in the following areas:
-
Database: An event of database information is recorded when the last application disconnects from the database.
-
Tables: All active table events will be recorded when the last application disconnects from the database. An active table is one which has been altered or created since the database was activated. The monitor captures the number of rows read and written to the table.
-
Deadlocks: A deadlock event is recorded immediately when a deadlock occurs. This monitor also has an additional option, with details. The option will capture additional information, such as what SQL was being executed when the deadlock occurred, and what locks were held by the application that encountered the deadlock. The information captured by the monitor focuses on the locks involved in the deadlock and the applications that own them.
-
Buffer pools: A buffer pool event is recorded when the last application disconnects from the database. The information captured contains the type and volume of use of the buffer pool, use of pre-fetchers and page cleaners, and whether or not direct I/O was used.
-
Table spaces: A table space event is recorded when the last application disconnects from the database. This monitor captures the same information as the buffer pool monitor, but the information is summarized at a table space level.
-
Connections: A connection event is recorded whenever an application disconnects from the database.
-
Transactions: A transaction event is recorded whenever a transaction finishes. The event will be written out whenever a commit or rollback occurs. The monitor captures all of the individual statement data, and also information about the transaction, such as its start and stop time.
-
Statements: A statement event is recorded when SQL statement end. The monitor records statement start and stop time, CPU used, text of dynamic SQL, return code of SQL statement, and other metrics such as fetch count.
Event monitors are created with CREATE EVENT MONITOR SQL statement. Information about event monitors is stored in the system catalog table, and it can be reused later.
Example 9-24 creates sample event monitor named DEADLOCK_EVMON. The query in the example access SYSCAT.EVENTMONITORS view and displays names of event monitors that have been created in the database.
Example 9-24: Creating sample event monitor
db2 create event monitor deadlock_evmon for deadlocks with details write to table manualstart db2 select evmonname from syscat.eventmonitors
The output of the DEADLOCK_EVMON monitor will be recorded in newly created tables. To check in advance what tables are to be created, or to generate syntax that overrides the default table names, use db2evtbl tool as shown in the Example 9-25.
Example 9-25: Generating table syntax for specified event monitor
db2evtbl -evm deadlock_evmon deadlocks with details CREATE EVENT MONITOR deadlock_evmon FOR DEADLOCKS WITH DETAILS WRITE TO TABLE CONNHEADER (TABLE CONNHEADER_deadlock_evmon, INCLUDES (AGENT_ID, APPL_ID, APPL_NAME, AUTH_ID, [...]
Because the DEADLOCK_EVMON monitor was created with a manual start, after creation it remains inactive. To activate a event monitor, change the state of the event monitor to value of 1 and use the event_mon_state() function to check for the current state, as shown in Example 9-26 (when calling event_mon_state() use event monitor name in uppercase). After activation of DEADLOCK_EVMON, each time a deadlock occurs in the database it will be recorded in the event monitor tables.
Example 9-26: Enabling event monitor
db2 set event monitor deadlock_evmon state = 1 db2 values event_mon_state('DEADLOCK_EVMON') To browse the data collected by event monitor, you can directly access the tables, or use the GUI tool db2eva. The sample db2eva screen capture is presented in Figure 9-10. For more information about db2eva, refer to DB2 UDB Command Reference.
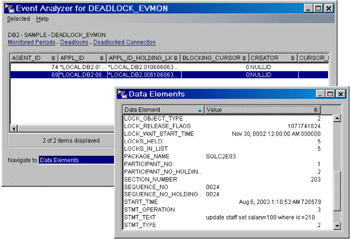
Figure 9-10: Presenting event monitor data using db2eva GUI tool
Event monitors offer an option to write the monitored information to a binary file. This option is particularly useful when there is a need to prevent the event monitor from collecting uncontrolled amount of data. Example 9-27 shows creation of event monitor that writes the diagnostic data to files (extensions *.EVT) located on the 'c:\tmp\deadlock' directory (Windows example). If the total amount of collected data exceeds 5000 pages (4 KB) the event monitor will stopped.
Example 9-27: Creating event monitor with file option
db2 create event monitor deadlock_evmon for deadlocks with details write to file 'c:\tmp\deadlock' maxfilesize 5000 manualstart
To convert the event monitor binary files to user readable form use db2evmon utility as shown in Example 9-28.
Example 9-28: Formatting event monitor output files
C:\tmp>db2evmon -path c:\tmp\deadlock Reading c:\tmp\00000000.EVT ... -------------------------------------------------------------------------- EVENT LOG HEADER Event Monitor name: DEADLOCK_EVMON Server Product ID: SQL08012 Version of event monitor data: 7 Byte order: LITTLE ENDIAN Number of nodes in db2 instance: 1 Codepage of database: 1252 Territory code of database: 1 Server instance name: DB2 -------------------------------------------------------------------------- -------------------------------------------------------------------------- Database Name: SAMPLE Database Path: C:\DB2\NODE0000\SQL00001\ First connection timestamp: 08-05-2003 23:25:43.028006 Event Monitor Start time: 08-06-2003 01:51:57.663712 -------------------------------------------------------------------------- 3) Deadlock Event ... Deadlock ID: 4 Number of applications deadlocked: 2 Deadlock detection time: 08-06-2003 01:53:11.952919 Rolled back Appl participant no: 2 Rolled back Appl Id: *LOCAL.DB2.010686063633 Rolled back Appl seq number: : 0005 [...]
Visual Explain
Visual Explain is used to capture and view information about the access plan chosen by the DB2 optimizer for SQL statements as a graph. An access plan is a cost estimation of resource usage for a query, which is based on the available information, such as statistics for tables and indexes, instance and database configuration parameters, bind options and query optimization level, and so on. An access plan also specifies the order of operations for accessing the data.
The access plan acquired from Visual Explain helps to understand how individual SQL statements are executed. The information available from the Visual Explain graph can be used to tune the SQL queries for better performance.
To start Visual Explain, launch the Control Center, right-click the database name and select either the Explain SQL or Show Explained Statements History option. You can input an SQL statement manually or import the SQL statement through the Get button available in the Explain SQL window. You can also specify the optimization class for the SQL statement in the same window. The optimization class implies the effort the DB2 optimizer will spend on preparing execution plan (higher value means more sophisticated optimization). Figure 9-11 shows an example of an access plan graph.
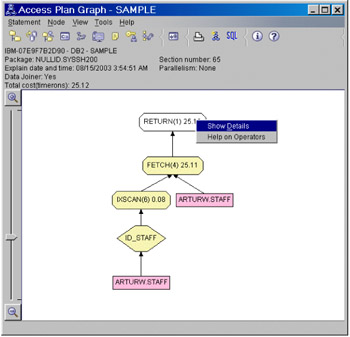
Figure 9-11: A Visual Explain access plan graph
An access plan graph shows details of:
-
Tables (and their associated columns) and indexes
-
Operators (such as table scans, sorts, and joins)
-
Table spaces and functions
To get the details right-click the desired graph element.
|
| < Day Day Up > |
|