Chapter 71: Pricing Products by Using Tie-Ins
Overview
-
How does the fact that customers buy razor blades as well as razors affect the profit-maximizing price of razors?
Certain consumer product purchases frequently result in the purchase of related products, or tie-ins. Here are some examples:
| Original purchase | Tie-in product |
|---|---|
| Razor | Razor blades |
| Men’s suit | Shirt and/or tie |
| Personal computer | Software training manual |
| Video game console | Video game |
Using the techniques I described in Chapter 70, “Estimating a Demand Curve,” it’s easy to determine a demand curve for the product that’s originally purchased. We can then use Microsoft Office Excel Solver to determine the original product price that maximizes the sum of the profit earned from the original and the tie-in products. The following example shows how this analysis is done.
-
How does the fact that customers buy razor blades as well as razors affect the profit-maximizing price of razors?
-
Suppose that we’re currently charging $5.00 for a razor and we’re selling 6 million razors. Assume that the variable cost of producing a razor is $2.00. Finally, suppose that the price elasticity of demand for razors is 2. What price should we charge for razors?
-
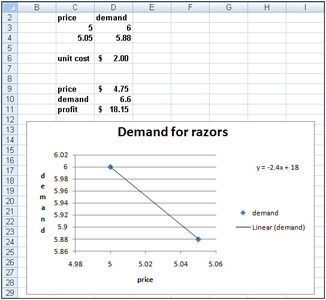
Let’s assume (incorrectly) that no purchasers of razors buy blades. We determine our demand curve (assuming a linear demand curve) as shown in Figure 71-1 on the next page. (You can find this data and the chart on the No Blades worksheet in the file Razors-andblades.xlsx.) Two points on the demand curve are price=$5.00, demand=6 million razors and price=$5.05 (an increase of 1 percent), demand=5.88 million (2 percent less than 6 million). After drawing a chart and inserting a linear trend line as shown in Chapter 70, we find the demand curve equation is y=18–2.4x. Because x equals price and y equals demand, we can write the demand curve for razors as follows: demand (in millions)=18– 2.4(price).

Figure 71-1: Determining the profit-maximizing price for razors -
I associate the names in cell C6 and the range C9:C11 with cells D6 and D9:D11. Next, I enter a trial price in D9 and determine demand for that price in cell D10 with the formula 18-2.4*price. Then I determine in cell D11 the profit for razors by using the formula demand*(price–unit_cost).
-
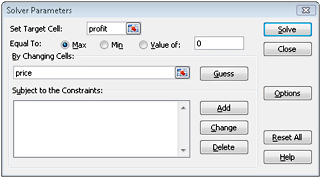
Next, I use Solver to determine the profit-maximizing price. The Solver Parameters dialog box is shown in Figure 71-2.

Figure 71-2: Solver Parameters dialog box set up for maximizing razor profit -
We choose to maximize our profit cell (cell D11) by changing our price (cell D9). The model is not linear because our target cell multiplies together two quantities-demand and (price–cost)-each depending on our changing cell. Solver finds that by charging $4.75 for a razor, we can maximize our profit. (Maximum profit is $18.15 million.)
-
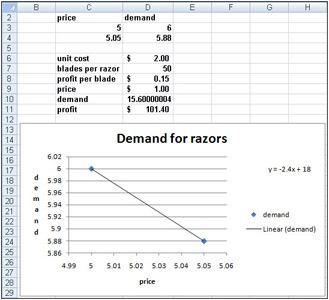
Now let’s suppose that the average purchaser of a razor buys 50 blades and that we earn $0.15 of profit per blade purchased. How does this change the price we should charge for a razor? We assume that the price of a blade is fixed. (In Problem 3 at the end of the chapter, we will allow the blade price to change.) Our analysis is in the Blades worksheet, which is shown in Figure 71-3.

Figure 71-3: Price for razors with blade profit included -
I used the Create From Selection command in the Defined Names group on the Formulas tab to associate the names in cells C6:C11 with cells D6:D11. (For example, cell D10 is named Demand.)
Note The astute reader will recall that I also named cell D10 of the No Blades worksheet Demand. What does Excel do when you use the range name Demand in a formula? Excel simply refers to the cell named Demand in the current worksheet. In other words, when we use the range name Demand in the Blades worksheet, Excel refers to cell D10 of that worksheet, and not to cell D10 in the No Blades worksheet.
-
In cells D7 and D8, I’ve entered the relevant information about blades. In D9, I entered a trial price for razors, and in D10, I computed our demand with the formula 18-2.4*price. Next, in cell D11, I computed total profit from razors and blades with the formula demand*(price–unit_cost)+demand*blades_per_razor*profit_per_blade. Notice that demand*blades_per_razor*profit_per_blade is our profit from blades.
-
Our Solver setup is exactly as was shown earlier in Figure 71-2: change the price to maximize the profit. Of course, now our profit formula includes the profit earned from blades. We find that profit is maximized by charging only $1.00 (half the variable cost!) for a razor. This price results from making so much money from the blades. We are much better off ensuring that many people have razors even though we lose $1.00 on each razor sold. Many companies do not understand the importance of the profit from tie-in products. This leads them to overprice their primary product and not maximize their total profit.
EAN: 2147483647
Pages: 200