Estimating the Smoothing Constants
We are now ready to estimate our smoothing constants. In column C, we will update the series base; in column D, the series trend; and in column G, our seasonal indexes. In column E, we compute our forecast for next month, and in column F, we compute our absolute percentage error for each month. Finally, we will use solver to choose smoothing constant values that minimize the sum of our absolute percentage errors. We’ll use the following process.
-
Step 1: In G11:I11, we enter trial values (between 0 and 1) for our smoothing constants.
-
Step 2: In C26:C119, we compute the updated series level with (1) by copying from C26 to C27:C119 the formula =alp*(B26/G14)+(1–alp)*(C25*D25).
-
Step 3: In D26:D119, we use (2) to update the series trend. Copy from D26 to D27:D119 the formula =bet*(C26/C25)+(1–bet)*D25.
-
Step 4: In G26:G119, we use (3) to update the seasonal indexes. Copy from G26 to G27:G119 the formula =gam*(B26/C26)+(1–gam)*G14.
-
Step 5: In E26:E119, we use (4) to compute the forecast for the current month by copying from E26 to E27:E119 the formula =(C25*D25)*G14.
-
Step 6: In F26:F119, we compute the absolute percentage error for each month by copying from F26 to F27:F119 the formula =ABS(B26-E26)/B26.
-
Step 7: We compute the average absolute percentage error for the years 1988 through 1996 in F21 with the formula =AVERAGE(F26:F119).
-
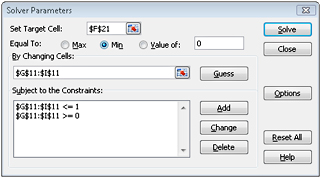
Step 8: We can now use the Microsoft Office Excel 2007 Solver feature to determine smoothing parameter values that minimize our average absolute percentage error. The Solver Parameters dialog box is shown in Figure 53-2.

Figure 53-2: Solver Parameters dialog box for Winter’s model
We choose our smoothing parameters (G11:I11) to minimize the average absolute percentage error (cell F21). The Excel Solver ensures we will find the best combination of smoothing constants. Smoothing constants must be between 0 and 1. We find that alp=.54, bet=.02, and gam=.29 minimizes our average absolute percentage error. You might find slightly different values of the smoothing constants, but you should obtain a MAPE close to 7.3 percent. In this example, there are many combinations of the smoothing constants that give forecasts having approximately the same MAPE. Our one-month-ahead forecasts are off by an average of 7.3 percent.
EAN: 2147483647
Pages: 200